ESA Aeolus
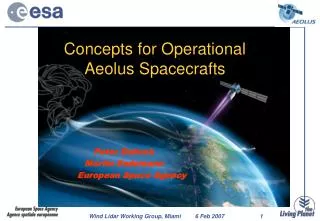
The Simulation of Doppler Wind Lidar Observations in Preparation for ESA’s Aeolus Mission Will McCarty NASA/Goddard Space Flight Center Global Modeling and Assimilation Office R. Errico, R. Yang, R. Gelaro, M. Rienecker. ESA Aeolus. Direct-Detection technique (355 nm)

ESA Aeolus
E N D
Presentation Transcript
The Simulation of Doppler Wind Lidar Observations in Preparation for ESA’s Aeolus MissionWill McCartyNASA/Goddard Space Flight CenterGlobal Modeling and Assimilation OfficeR. Errico, R. Yang, R. Gelaro, M. Rienecker ISS Winds Mission Science Workshop
ESA Aeolus • Direct-Detection technique (355 nm) • Vertical single-component profiles in clear sky (Rayleigh) • Higher quality measurements in presence of scattering agent (Mie) • Orbit Characteristics • 408 km • Dawn-dusk • Sun-synchronous • Viewing Geometry/Sampling • 90° off-track (away from sun) • 35 ° off-nadir • Continuous sampling @ 50 Hz
ADM-Aeolus Pre-Launch Preparedness • Realistic Proxy Data - No spaceborne heritage, must simulate observations • Utilize OSSE framework • Joint OSSE Nature Run (ECMWF, T511) • Existing observing system developed in-house at GMAO (R. Errico) • conventional and remotely-sensed observations • Simulate ADM observations • Lidar Performance Analysis Simulator (LIPAS), via KNMI (G.-J. Marseille & A. Stoffelen) • Need proper sampling (spatial & vertical), yield, and errorcharacteristics • Not intended to sell Aeolus (already sold)
What is an OSSE Assimilation of Real Data Real Evolving Atmosphere, with imperfect observations. Truth unknown Analysis Analysis Analysis Time Analysis Analysis Analysis Climate simulation, with simulated imperfect “observations.” Truth known. Observing System Simulation Experiment
Simulating Observations • Six million+ observations are assimilated globally, daily • Most observations are from satellites • A successful OSSE requires realistic fake observations Figure via ECMWF
Clouds in the Joint OSSE Nature Run • Importance of clouds • The top of a cloud can act as a scattering agent • Optically thick clouds limit wind retrievals • Placement of clouds • Realistic vertical placement of clouds • NR underestimates cloud amount • ~12% globally • Related to measurement yield DJF Cloud Fraction Difference (NR – CloudSat/CALIPSO) NR Over-Represents clouds NR Under-Represents clouds Improper Cloud Representation… …Improper Observation Yield & Quality
Observation Simulation • Lidar Performance Analysis Simulator (LIPAS) • Single-LOS observations generated from NR • Meteorology from NR • Clouds from NR w/ maximum-random overlap • Aerosols from GOCART replay forced by NR Meteorology
Observation Simulation • Lidar Performance Analysis Simulator (LIPAS) • Single-LOS observations generated from NR • Meteorology from NR • Clouds from NR w/ maximum-random overlap • Aerosols from GOCART replay forced by NR Meteorology
Assimilation Results • All results shown are from January of Joint OSSE Nature Run • 0000 and 1200 UTC analyses only • Control experiment include conventional & remotely sensed observation simulated from Nature Run • Radiances include TOVS/ATOVS, AIRS • Remotely sensed atmospheric winds from Atmospheric Motion Vectors (AMVs) • Experiments: • DWL – Both Rayleigh and Mie observations • RAY – Rayleigh only • MIE – Mie only
Assimilation Results • Results shown are in terms of reduction of RMS relative to the Nature Run Truth: • δRMS = RMS(DWL – Truth) – RMS(CTL – Truth) • If δRMS < 0, RMS is reduced by adding DWL observation, or the analysis is improved relative to the NR truth • If δRMS > 0, RMS is increased by adding DWL observations, or the analysis is degraded relative to the NR truth
Assimilation Results Large reductions of RMS seen over tropics • Existing Observations primarily of mass field (passive satellite radiances) • Winds cannot be inferred through balance assumptions Increase in RMS by adding DWL Zonal Wind RMS Difference (ms-1) Reduction in RMS by adding DWL
Assimilation Results Reductions also seen in meridional wind field • At equator,single-LOS obs are nearly u (~83º from due-north @ equator) Increase in RMS by adding DWL Meridional Wind RMS Difference (ms-1) Reduction in RMS by adding DWL
Assimilation Results • Smaller contour intervals show mostly positive in both N. & S. hemispheres • Evidence of satellite tracks • Less in data-rich N. Hemisphere • 00/12 UTC Sondes Increase in RMS by adding DWL Zonal Wind RMS Difference (ms-1) Reduction in RMS by adding DWL
Assimilation Results • Impact at 200 hPa consistent through troposphere • Less impact towards surface • Less observations • Increased contamination • Lesser impacts in N./S. hemispheres • Winds through mass-wind balance Tropics (-30º to 30º) NH Extratropics (30º to 90º) SH Extratropics (-90º to -30º)
Assimilation Results • Relative humidity similar to winds • Largest impacts again seen in Tropics • The improved characterization of the winds improves the transport of moisture • No balance between moisture/winds in analysis procedure Tropics (-30º to 30º) NH (30º to 90º) SH (-90º to -30º) Tropics (-30º to 30º) NH Extratropics (30º to 90º) SH Extratropics (-90º to -30º)
Assimilation Results • Improvement less uniform, but still dominant signal Relative Humidity RMS Difference (%)
Assimilation Results • Larger impact from Rayleigh Obs • ~3x More Observations aloft • Rayleigh obs error characteristics more predictable • Mie positive in tropics, neutral in extratropics DWL (Rayleigh + Mie) Mie Only Zonal Wind RMS Difference (ms-1)
Assimilation Results • Larger impact from Rayleigh Obs • ~3x More Observations aloft • Rayleigh obs error characteristics more predictable • Mie positive in tropics, neutral in extratropics DWL (Rayleigh + Mie) Rayleigh Only Zonal Wind RMS Difference (ms-1)
Assimilation Results • Larger impact from Rayleigh Obs • ~3x More Observations aloft • Rayleigh obs error characteristics more predictable • Mie positive in tropics, neutral in extratropics DWL (Both) Rayleigh Only Mie Only
Assimilation Results 200 hPa 850 hPa
Assimilation Results • At 850 hPa, impacts are more similar w/ two observation types RAY DWL MIE Zonal Wind RMS Difference (ms-1)
Conclusions, Caveats, and Future Efforts • These results are overstated! • Error in simulated DWL observations inherently understated • No added representativeness error, engineering change from Burst Mode to Continuous Mode • Error in Yield • Lack of clouds in NR not accounted for in DWL obs simulation • Forecast height anomaly scores improved, though not beyond 95% significance for sample size • Shows expected result that largest impact is expected in tropics • Future work • Include incorporation of L2B processing into DA System (GSI) • Redo experiment w/ simulator updated for continuous mode ops
Assimilation Results • Similar impact from both obs types • Counts similar • Sampling issue near Antarctic • Mie potentially slightly improved in tropics DWL (Both) Rayleigh Only Mie Only