Download
1 / 38
380 likes | 528 Vues
www.bjerknes.uib.no. Observed and projected climate change – from global to local scale. Helge Drange helge.drange@gfi.uib.no. CO 2 in air (from Mauna Loa, Hawaii). CO 2 (parts per million). 2008. 2009. 2010. 2011. 2012. 1912. Change in heat content of ocean & land+atm+ice.

E N D
www.bjerknes.uib.no Observed and projected climate change –from global to local scale Helge Drangehelge.drange@gfi.uib.no
CO2 in air (from Mauna Loa, Hawaii) CO2 (parts per million)
Change in heat content of ocean & land+atm+ice Change in heat (1022 J) Church et al (2011)
Change in heat content of ocean & land+atm+ice Change in heat (1022 J) Church et al (2011)
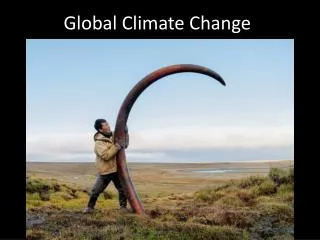
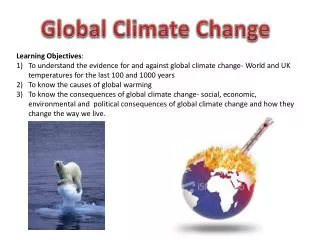
Earth´s climate is changing Main reason is our use of coal, oil and gas
Possible future uncertainty ≠ no certainty
Change in global temperature, 15 models (relative to 1961-1990)
Change in global temperature, 15 models (relative to 1961-1990) +2 °C 2025-2050 In 2100: Global: 4.0-5.8 °C Land: 5.0-8.5 °C Future emissions as today (“Business-as-usual”)
Change in global temperature, 15 models (relative to 1961-1990) +2 °C 2035-2075 In 2100: Global: 2.0-3.0 °C Land: 2.1-4.8 °C For a global, mean warming of ~2 °C, which we can expect sometime during second half of the 21st century, Earth's climate is comparable to the climate ~3.2 mill years ago Global emission top in 2040, 650 ppm CO2-eq in 2100
Drought index based on 14 climate models (2090-2099; RCP4.5) Severe to extreme drought Incr soil moisture Dai, Nature Clim. Change (2012)
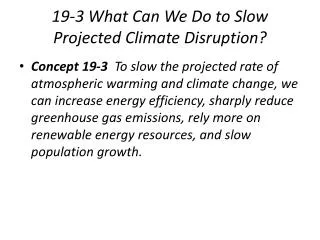
Over to local scale (where we all live) Much harder to do local than continental/global climate projections! Harder to make projections of precipitation than temperature Very hard to make projections about local changes in extremes
14 Sep 2005 For Bergen: +30 to +70 % increase in extreme precipitation by the end of the century
Photo: Jan M. Lillebø, Bergens Tidende Sea level
Warming of the ocean May contribute 15-20 cm in this century Total: +40 to +80 cm in 2100 Cont’d increase “forever” Glaciers melting May contribute 15-20 cm in this century Greenland and Antarctica May contribute 10-40 cm in this century (large uncertainties)
Estimated sea level rise (cm) along the coast of Norway, next 100 years (corresponding to a global sea level rise of 50-110 cm) About 1/3 of this rise by 2050 Drange m.fl. (2012)
Sea level Will last for > 1000 yr
2-degree target: Consequence of delaying cuts in CO2-emissions (i) CO2-emissions from coal, oil and gas, 1950-2012 Global CO2-emissions (Gt-C) Meinshausen et al. (2009), updated
2-degree target: Consequence of delaying cuts in CO2-emissions (ii) Reduced CO2-emissions from 2013 2013: − 7 % / yr Global CO2-emissions (Gt-C) Meinshausen et al. (2009), updated
2-degree target: Consequence of delaying cuts in CO2-emissions (iii) Reduced CO2-emissions from 2017 2013: − 7 % / yr 2017: −11 % / yr Global CO2-emissions (Gt-C) Meinshausen et al. (2009), updated
2-degree target: Consequence of delaying cuts in CO2-emissions (iv) Reduced CO2-emissions from 2021 2013: − 7 % / yr 2017: −11 % / yr 2021: −22 % / yr Global CO2-emissions (Gt-C) Meinshausen et al. (2009), updated
2-degree target: Consequence of delaying cuts in CO2-emissions (v) Reduced CO2-emissions from 2025 2013: − 7 % / yr ? 2017: −11 % / yr 2021: −22 % / yr 2025: −90 % / yr Global CO2-emissions (Gt-C) Meinshausen et al. (2009), updated
About 20 percent of today's CO2-emissions will remain in the atmosphere for 1000 years or more
Slides and animations available from helge.drange@gfi.uib.no Earthrise, 24 Dec 1968 (credit: NASA)