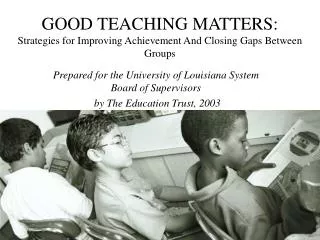
IMPROVING ACHIEVEMENT AND CLOSING GAPS BETWEEN GROUPS
IMPROVING ACHIEVEMENT AND CLOSING GAPS BETWEEN GROUPS. Prepared for the National Evaluation Institute Education Trust, 2003. What Do We Know About Student Achievement?. 12th Grade Achievement In Math and Science is Up Somewhat. High School Achievement: Math and Science.

IMPROVING ACHIEVEMENT AND CLOSING GAPS BETWEEN GROUPS
E N D
Presentation Transcript
IMPROVING ACHIEVEMENT AND CLOSING GAPS BETWEEN GROUPS Prepared for the National Evaluation Institute Education Trust, 2003
High School Achievement: Math and Science Source: NAEP 1999 Trends in Academic Progress.
What about different groups of students?During seventies and eighties, much progress.
Gaps Narrow 1970-88NAEP Reading 17 Year-Olds Source: US Department of Education, National Center for Education Statistics. NAEP 1999 Trends in Academic Progress (p. 107) Washington, DC: US Department of Education, August 2000
Gaps Narrow 1973-86NAEP Math Scores, 13 Year-Olds Source: US Department of Education, National Center for Education Statistics. NAEP 1999 Trends in Academic Progress (p. 108) Washington, DC: US Department of Education, August 2000
Between 1988-90, that progress came to a halt…and gaps began to widen once again.
Gaps Narrow, Then Hold Steady or Widen: NAEP Math Scores, 17 Year-Olds 32 20 Source: US Department of Education, National Center for Education Statistics. NAEP 1999 Trends in Academic Progress (p. 108) Washington, DC: US Department of Education, August 2000
Value Added Declining in High School Math Age 13-17 Growth Source: NAEP 1999 Trends in Academic Progress; updated with 2000 NAEP results.
Reading: Students Entering Better Prepared, But Leaving Worse Source: NAEP 1996 Trends in Academic Progress
After 1988, Gaps Mostly Widen NAEP Reading, 17 Year-Olds 21 31 Source: US Department of Education, National Center for Education Statistics. NAEP 1999 Trends in Academic Progress (p. 107) Washington, DC: US Department of Education, August 2000
Where Are We Now?NAEP 8th Grade Mathematics All Students 2000
African American and Latino 17 Year Olds Do Math at Same Levels As White 13 Year Olds Source: NAEP 1999 Long Term Trends Summary Tables (online)
African American and Latino 17 Year Olds Read at Same Levels as White 13 Year Olds Source: Source: NAEP 1999 Long Term Trends Summary Tables (online)
Not Surprisingly, These Patterns Also Clear in HS Graduation, College Entry and Graduation Rates
Students Graduate From High School At Different Rates Source: US Bureau of Census, Current Population Reports, Educational Attainment in the United States: March 1998 (p. 20-513), Detailed Tables No. 2
Highest Achieving Low-Income Students Attend Postsecondary at Same Rate as Bottom Achieving High Income Students Source: NELS: 88, Second (1992) and Third Follow up (1994); in, USDOE, NCES, NCES Condition of Education 1997 p. 64
Of Every 100 White Kindergartners: (24 Year-Olds) Source: US Bureau of Census, Current Population Reports, Educational Attainment in the United States; March 2000, Detailed Tables No. 2
Of Every 100 African American Kindergartners: (24 Year-Olds) Source: US Bureau of Census, Current Population Reports, Educational Attainment in the United States; March 2000, Detailed Tables No. 2
Of Every 100 Latino Kindergartners: (24 Year-Olds) Source: US Bureau of Census, Current Population Reports, Educational Attainment in the United States; March 2000, Detailed Tables No. 2
Of Every 100 American Indian/Alaskan Native Kindergartners: (24 Year Olds)
College Graduates by Age 26 Source: Tom Mortenson, Research Seminar on Public Policy Analysis of Opportunity for Post Secondary, 1997.
What We Hear Adults Say: • They’re poor; • Their parents don’t care; • They come to schools without breakfast; • Not enough books • Not enough parents . . .
But if they’re right, then why are poor and minority children performing so high in...
Wrigley Elementary • 78% Low-Income • 3rd Highest Performing in State in Reading • 6th Highest Performing in State in Writing KENTUCKY
Source: Education Trust analysis of data from National School-Level State Assessment Score Database (www.schooldata.org).
Source: Education Trust analysis of data from National School-Level State Assessment Score Database (www.schooldata.org).
Source: Education Trust analysis of data from National School-Level State Assessment Score Database (www.schooldata.org).
Mount Royal Elementary/Middle, Baltimore, MD • 99% African American • 73% Low-Income • Highest Performing in State on state’s 5th grade Math test. • Top 10% of state in 5th grade reading. MARYLAND
Pimlico Elementary, Baltimore, MD • 100% African American • 94% Low-Income • Top 1% in improvement on the state’s 5th grade Math test. Maryland
Hambrick Middle School,Aldine, TX • 94% African American and Latino (state = 56%) • 85% low-income (state = 50%) • Has performed in the top fifth of all Texas middle schools in both reading and math in both 7th and 8th grades over a 3-year period.
Prince Edward County High, Farmville VA (715 students – 55% African American and Latino) Sources: Virginia Department of Education Web site, http://www.pen.k12.va.us/VDOE/Assessment/2002SOLpassrates.html.