Lecture 8: Mass Spectrometry, Applications
Lecture 8: Mass Spectrometry, Applications Last week we saw how we do Mass Spectrometry, now we will see why we do mass spectrometry Mass Spec is a technique which, when you take a mixture of stuff, nearly everything in that mixture will give you an independent signal .


Lecture 8: Mass Spectrometry, Applications
E N D
Presentation Transcript
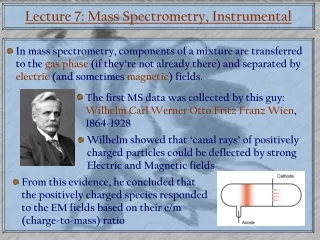
Lecture 8: Mass Spectrometry, Applications Last week we saw how we do Mass Spectrometry, now we will see why we do mass spectrometry Mass Spec is a technique which, when you take a mixture of stuff, nearly everything in that mixture will give you an independent signal. Mass Spec is highly selective. Unlike pretty much every other technique that we talked about, it does not give you the average state of your solution analyte. Mass Spec can be highly sensitive. It is ideal for measuring low conc. analytes Mass Spec can be very easy! Both from a theoretical standpoint and an operational one.
What Can We Use MS For? Here are some applications for Mass Spectrometry: - Drug testing/Pharmacokinetics - Antiterror/Security (e.g. bomb molecule ‘sniffers’) - Environmental Analysis (e.g. water quality testing) - Quality Control (food, pharmaceuticals) - Medical Testing (various blood illnesses and… cancer?) - Validation of art/History/Anthropology etc. - Validation during chemical synthesis We are going to focus on: Biochemical research (proteomics, interact…omics) Biochemical kinetics and mechanisms Tissue imaging (with MALDI)
Mass Spectrometry: Application Terms Sensitivity: Simply the lowest analyte concentration at which you can get a meaningful signal to noise ratio. The cutoff for ‘real’ signals is supposed to be S/N≥10, but lots of people base their results on less than that! Resolution: Usually defined as the measured mass m divided by the width of the peak m at half the maximum peak hight (Full Width Half Maximum, FWHM) m I m m/z
Mass Spectrometry: World Records! Just so that we understand the power of this technique… Sensitivity: We know that FT-ICR can detect a single trapped ion, but we have to get it there! The current record for sensitivity is… ~10 zeptomol (10-20 M, about 6,000 molecules)! Used ESI / FT-ICR M. E. Belov, E. N. Nikolaev, G. A. Anderson, H. R. Udesth, T. P. Conrads, T. D. Veenstra, C. D. Masselon, M. V. Gorshkov and R. D. Smith, Anal. Chem., 2001, 73, 253–261
Mass Spectrometry: World Records! Mass Accuracy: No real world record. Strongly depends on m/z. For proteins, the highest reported mass accuracy is about 1 ppm:
Mass Spectrometry: World Records! Maximum m/z: In 2000, CV Robinson et al. got a intact, ~2.5 MDa viral capsid through their Q-TOF instrument They measured 2,484,700 Da. Actual mass: 2,471,130 Da. Error = 13570 Da…or .5% Mass Spectrometry-ish mass estimates of ‘live’ viruses (up to ~42 MDa) have been made by Bothner, Siuzdak et al. J. Am. Chem. Soc. 2000, 122, 3550-3551
Mass Spectrometry: World Records! Resolution: This is the one you’ve all been waiting for… In 2001, Allan Marshall’s group measured the difference in mass between the peptides: RVMRGMR and RSHRGHR They managed a resolution of 3,300,000… And successfully managed the mass difference of .00045 Da… which is less than the mass of an electron! (.00055 Da) Anal. Chem. 2001, 73, 647-650
Applications: Proteomics OK, so we’ve sequenced the genome. This gives us important information about disease implicated mutants, human genetic diversity etc., but… Which regions of the DNA are ‘coding regions’? What proteins result from the coding regions (after mRNA splicing, processing etc.)? When are the proteins produced? In what quantities? For a relatively short period in the early 90’s, we had all kinds of ways of sequencing DNA, but no good way of figuring out if we were looking at junk or genes. Mass Spectrometry to the Rescue!!!
Applications: Proteomics Remember, mass spec is very good at separating mixtures, so we can just take our cell lysates, toss them in to an FT-ICR and get all of the masses of all the proteins therein. Right?? NO!
Proteomics Not really. Here are the problems: The spectrum will be ridiculously complicated with thousands of proteins each having numerous charge states. Even by FT-ICR, this won’t fly. You have no basis for identifying new proteins. In order to identify a protein this way, you have to have prior knowledge of it’s sequence. This could be called the ultimate ‘top down’ approach. It won’t work straight up, but there are ways to deal with the above hurdles…
Proteomics and Pre-separation The first thing we might want to do is to pre-separate our cell lysate: Top-down. Identify protein by it’s exact mass orexact masses of MS/MS fragments. Peptides Protein Protease Now we have a test tube full of peptides from a single protein… what shall we do??
Proteomics and LC-MS In a sense, we’ve now made our simple (single protein) sample quite complex. There are many peptides each probably having a number of charge states… So we can pre-separate again! This time we use Reverse Phase High Performance Liquid Chromatography (HPLC) Reverse Phase Column I time
Proteomics and LC-MS Under each one of our LC-MS Intensity vs. time peaks, there should be a single peptide for us to analyze. I I I m/z m/z m/z We can now either take the peptides we have and try to figure out what the protein is by matching our masses up to a database of protein sequences. Matching protein Found!!! MGLSDGEWQL VLNAWGKVEA DVAGHGQEVL IRLFTGHPET LEKFDKFKHL KTEAEMKASE DLKKHGNTVL TALGGILKKK GHHEAEVKHL AESHANKHKI PVKYLEFISD AIIHVLHAKH PSDFGADAQA AMSKALELFR NDMAAQYKVL GFHG Masses of measured peptides: 1508.6378 GLSDGEWQLVL 1756.9029 IIHVLHAKH PSDF 1160.31420 ESHANKHKI 582.66871 KKHGN
Sequencing New Proteins But what if none of the peptides we observe are not part of a known protein sequence? What if we can’t measure the masses of big peptides accurately enough to be sure? We can sequence peptides by MS/MS!! When we bust up a peptide in the conventional way, it tends to break at the peptide bond, forming yand b ions: y b
MS/MS of Peptides for Sequencing Where the peptide bond breaks is quite random (although there are some strong preferences for certain a.a. pairs) So our MS/MS spectrum will actually consist of many y and b ions corresponding to breaks at different locations. Our spectrum is now made up of much smaller units which are much easier to identify.
Proteomics: Bringing it Together So now we have a method by which we can take cell lysates and come out with an idea of the protein complement of the cell, even if we have no prior knowledge of some of the proteins! Note that we’ve separated our sample a bunch of times… this is not good for sample retention. And given the low copy number of some proteins in the cell, we may not have had much to begin with. Probably the most serious challenge in proteomics is sensitivity. We could avoid a lot of sample loss if only we could use a ‘top down’ approach, that is to identify proteins by their exact masses rather than the masses of their peptides. Note also that we’ve only talked so far about identifying proteins. If we want to, say be able to screen for cancer, we’d better be able to quantify the proteins we identify.
Proteomics and Quantitative MS Mass Spectrometry is very bad at giving quantitative data. Sometimes slight chemical dissimilarities can lead to drastic differences in ionization efficiency. The solution is to use isotopic standards. In this way, we can distinguish two analytes that are chemically the same. This approach has been implemented in proteomics with the Applied Biosystems iTRAQ system. Note that here you measure the abundance of the tag.
Proteomics and Protein Modification Many, many proteins undergo posttranslational modifications Since these modifications change the mass, this will tend to make our data, especially top down data, much more difficult to analyze. Some posttransltional modifications of note include: acetylation, alkylation, amidation, biotinylation, hydroxylation, formylation, oxidation,phosphorylation
Posttranslational Modifications: Good News On the other hand, these posttranlstional modifications are biologically relevant and we can detect them by MS. Consequently, there are proteomics people who specialize in identifying PTMs, especially phosphorylation.
Proteomics Example Here’s an example of a ‘top down’ study using LC and FT-ICR Lysate from S. cerevisiae Used N14 (anaerobic) and N15 (aerobic) to detect differential expression Anal. Chem. 2007, 79, 7984-7991
Protein Folding and Conformational Dynamics So far we’ve discussed a method for identifying proteins, even ones that are unknown, but MS can also help us understand how they do what they do. A straightforward question is to identify the folding state of a protein. Cytochrome c Hemoglobin Konermann et al. Kaltashov et al.
H/D Exchange (HDX) Apart from the charge state distribution, we can also study protein folding and dynamics by MS by exchanging deuterium onto the amide groups of the peptide backbone. The exchange of amide protons for deuterium happens on the millisecond timescale, which is the same timescale as large motions in protein folding. Thus we can have two limiting scenarios: Exchange is much faster than the rate of closing (EX1) The ‘closing rate’ is much faster than exchange (EX2) Intrinsic exchange rate ‘opening’ rate Observed rate of exchange kop/kcl
Mass Spectrometry: World Records! For EX2, every time the protein ‘opens’ there is a probability that a deuteron will exchange on. Deuterons appear little by little. For EX1, when the protein ‘opens’, all amide groups exposed as a consequence of that motion are exposed. Deuterons are exchanged on all at once Biochemistry, Vol. 42, No. 19, 2003
Pulse vs. Continuous Labeling The are two approaches to HD exchange MS: Continuous Labeling and Pulse Labeling In continuous labeling, the mass of the protein is monitored as a function of time in D2O This is good for monitoring protein dynamics, both EX1 and EX2 can be observed directly In pulse labeling, the idea is to get a ‘solvent exposure snapshot’ of a protein that is undergoing a folding/unfolding transition. The protein is allowed to fold for a variable time, then is exposed very briefly to D2O prior to analysis. This provides an additional way of monitoring changes in protein structure as a function of time.
Spatially Resolved HDX MS-based HDX usually does not offer ‘site specific’ info about protein folding. You can only see what’s going on over the whole molecule. BUT… You can try to get site specific information using the following steps: D D D D pepsin D pulse label D D D D D pH 3 D D D D
React Mix Outer capillary is ion source Time-resolved ESI-MS Most conformational fluctuations associated with protein function, and the early steps of enzyme kinetics happen on the millisecond time-scale If we’re going to study any of these event by MS, we need to be device a rapid mixing system that can be coupled to a mass spectrometer. MS
t = 0 t = 150 ms t = 3 s t = 5 min ‘Spectral Mode’ Data Here is a brilliant study on Ubiquitin refolding Note how the small peaks hang around for 5 min or more! Prolyl isomerization
Mass Spectrometry: World Records! Ultimately, you can get entire mass spectra as a function of reaction time This study is also verybrilliant
Kinetics and HDX by MS To get even more data, we can combine our time-resolved MS device with HDX pulse labeling. This approach has been used to detect subtle folding intermediates Yet another brilliant study
MALDI of Tissue Samples Almost everything we’ve talked about so far is more suited to electrospray ionization that MALDI But when you think about how MALDI works, it practically begs to be used for tissue imaging. MS
MALDI Tissue Imaging Example Preparation is similar to histology, but section is embeded in a MALDI matrix instead of paraffin
MALDI Tissue Imaging Example 2 This technique provides a massive amount of data. You can plot the intensities of each ion as a function of x, y and z!
Emerging Areas for MS One exciting area is preparative MS, where the mass spectrometer is used to produce ultra high purity samples. For proteins, this will involve ‘soft landing’ the ion so that it isn’t destroyed when it crashes into the surface on which it is being collected.