Download
1 / 33
330 likes | 463 Vues
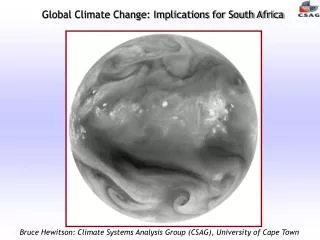
CLIMATE CHANGE AND ITS IMPLICATIONS FOR NATURAL SYSTEMS. CAMBIO CLIMÁTICO Y SUS IMPLICACIONES EN LOS SISTEMAS NATURALES. Dr. Hector Galbraith, Manomet Center for Conservation Sciences. CREDENTIALS – WHO IS THIS GUY?. CREDENCIALES – QUIÉN ES HÉCTOR?.

E N D
CLIMATE CHANGE AND ITS IMPLICATIONS FOR NATURAL SYSTEMS CAMBIO CLIMÁTICO Y SUS IMPLICACIONES EN LOS SISTEMAS NATURALES Dr. Hector Galbraith, Manomet Center for Conservation Sciences
CREDENTIALS – WHO IS THIS GUY? CREDENCIALES – QUIÉN ES HÉCTOR? • Training in avian ecology/Entrenamiento en ecología de aves • Prior to 1990s researched mainly avian population ecology – shorebirds and seabirds/antes de los 90s, investigaciones principalmente en ecología de las poblaciones de aves (playeras y marinas) • Beginning about 1993 began working on effects of climate change/principios de 1993 inició trabajos en efectos del cambio climático • Have published papers, book chapters and reports on cc impacts on natural resources/publicado articulos, capítulos de libros y reportes sobre el CC y sus impactos en los recursos naturales • Work funded by EPA, Pew, FWS, NPS, state agencies, etc./Trabajos financiados por EPA, Pew, FWS, NPS, agencias estatales, etc. • Now heading up Manomet’s Climate Change Initiative/Ahora es líder de la iniciativa de cambio climático para Manomet • Particularly interested in adaptation approaches/interés particular en formas de adaptación
OUTLINE OF TALKPUNTOS DE LA PLATICA • What is climate change and what is causing it?/ Qué es el cambio climático y qué lo está causando? • How bad might it get?/Qué tan mal puede llegar a ser? • Impacts on ecological resources?/Su impacto en los recursos ecológicos?
Greenhouse gases keep temperatures within limits that support life. Los gases del efecto invernadero mantienen las temperaturas dentro de los límites para mantener la vida THE GREENHOUSE EFFECT IS A GOOD THING!EL EFECTO INVERNADERO ES ALGO BUENO!
Mars temperature ranges from 0oF to -200oF. El rango de temperatura en Marte es de 0oF a -200oF. THE GREENHOUSE EFFECT IS A GOOD THING!EL EFECTO INVERNADERO ES ALGO BUENO!
Runaway greenhouse effect on Venus – hot enough to melt lead! Los efectos de los gases de invernadero en Venus- suficientemente caliente para derretir plomo THE GREENHOUSE EFFECT IS A GOOD THING!EL EFECTO INVERNADERO ES ALGO BUENO!
SO WHAT’S THE PROBLEM?ENTONCES, CUÁL ES EL PROBLEMA? • Since Industrial Revolution, we have been increasing the concentration of greenhouse gases in atmosphere. • Desde la Revolución Industrial, se han estado incrementando las concentraciones de gases de invernadero en la atmósfera • This became obvious and measurable in mid-20th Century • Se hace obvio y medible a mitad del sigo 20 • Basic physics tells us that increasing the greenhouse gas concentrations could lead to increase in planetary temperature. • La física básica nos dice que incrementando las concentraciones de los gases del efecto invernadero nos puede llevar a incrementar la temperatura del planeta
HOW MUCH WARMER COULD IT GET - EMISSIONS SCENARIOSQUÉ MÁS CALIDO PUEDE LLEGAR – ESCENARIOS DE EMISIONES • B1 – a doubling of CO2 (550ppm) • B1 – el doble de CO2 (550ppm) • A1FI – a tripling of CO2 (825ppm) • A1FI – el triple de CO2 (825ppm) Pre-industrial CO2 was about 275ppm We are now at 390ppm CO2 en la época preindustrial era cercano a 275ppm, ahora estamos en 390ppm
RESULTS OF GCM/EMISSIONS MODELING – TEMPERATURERESULTADOS DE GCM/MODELO DE EMISIONES-TEMPERATURA
DOWNSCALING - PROJECTED TEMPERATURE CHANGE (oC)1990 vs 2090A MENOR ESCALA- CAMBIOS DE TEMPERATURA PROYECTADOS (oC)1990 vs 2090 Regional Model/Modelo regional Statistical downscaled/ A menor escala estadística Statistical downscaling by Hayhoe et al. (2008)
Summer Heat Index – migrating climates Index de calor en el verano- climas en migración UCS, 2007
RESULTS OF GCM/EMISSIONS MODELING – SUMMER PRECIP.RESULTADOS DE GCM/MODELO DE EMISIONES- PRECIPITACIONES DE VERANO Statistical downscaling by Hayhoe et al. (2008)
The Changing Face of Winter – Higher Emissions Cambiando la cara en el invierno –emisiones mas altas Base map credit: Intrasearch d.b.a. MapMartSource: NECIA/UCS, 2007 (see: www.climatechoices.org/ne/)
WHAT ECOLOGICAL EFFECTS MIGHT OCCUR IN FUTURE? QUÉ EFECTOS ECOLÓGICOS PODRÍAN OCURRIR EN EL FUTURO • Range shifts/Cambios en los rangos: • Elevation/Elevación • Latitude /latitud • Shifts in timing of events (e.g., migration)/Cambios en los tiempos de los eventos (por ejemplo la migración) • Habitat loss or change/ Perdida o cambios de hábitat • Community dissociation/Desagrupación de comunidades • Extinctions (5-37%)/Extinción (5-37%)
Increasing Summer DroughtIncremento de sequías en el verano (1961-1990) (1961-1990) • Hotter summers increase evaporation rates and reduce soil moisture • Veranos más cálidos incrementan la evaporación y reducen la humedad del suelo • With higher emissions, project annual short-term droughts across much of the Northeast by end-of-century • Con emisiones de temperatura más altas, se tienen proyecciones de seguias en el corto plazo a través del Noreste de USA para finales de este siglo Lower emissions Lower emissions Short-termdrought (1-3months) (2070-2099) Higher emissions (2070-2099) Droughts/30 years
RANGE SHIFTS - TREE SWALLOW CAMBIOS DE DISTRIBUCIÓN DE GOLONDRINA BICOLOR (Tachycineta bicolor)
BLACK-CAPPED CHICKADEE IN TROUBLECARBONERO CABECINEGREO (Poecileatricapillus) EN PROBLEMAS
CAROLINA CHICKADEE MOVES NORTHCARBONERO DE CAROLINA SE MUEVE AL NORTE
Source: NECIA/UCS, 2007 (see: www.climatechoices.org/ne/) Range shifts - Hemlock Woolly Adelgid Jerry and Marcy Monkman
Extinctions - Bicknell’s thrush habitat declines sharply with rising temperatureExtinción- el hábitat del (Catharusbicknelli) tiene un descenso rápido causado por el incremento en la temperatura 160 140 120 100 80 BITH Habitat (1,000 ha) Low emissions 2.8°C High emissions 5.9°C 60 40 20 0 +1 +2 +3 +4 +5 +6 +7 +0 Mean July Temp. Change Relative to 1950-1980
TIMING IS EVERYTHING – PIED FLYCATCHERS IN EUROPETIEMPO ES TODO- EL PAPAMOSCAS CERROJILLO (Ficedulahypoleuca) EN EUROPA • Pied flycatchers breed in oak woodlands/Los papamoscas se reproducen en robles • They time their nesting season so that their chicks are in the nest during the seasonal flush of insects/Tienen las fechas de anidación para que los pollos esten en los nidos con la abundancia de insectos • Their breeding season is now out of “synch” since insects are now emerging earlier. /Su temporada de reproducción se encuentra fuera de sincronización debido a que los insectos están saliendo más temprano • Flycatcher productivity has crashed /La proudctividad de los papamoscas se desplomó
Source: NECIA/UCS, 2007 (see: www.climatechoices.org/ne/) Projected Rise in Global Sea Level Relative to 2005Proyecciones de incremento global del nivel del mar relativo para el 2005
9 8 7 6 5 4 Extent (million sq km) 2007 1978 1982 1986 1990 1994 1998 2002 2006
Greenland Total Melt Area – 2007 value exceeds last maximum by 10% Área total de derretida en Groelandía Los valoresexceden el últimomáximopor un 10% Konrad Steffen and Russell Huff, CIRES, University of Colorado at Boulder
Surface Melt on Greenland Superficie derretida en Groelandia Melt descending into a moulin, a vertical shaft carrying water to ice sheet base. El agua derretida en un molino, una caída vertical Source: Roger Braithwaite, University of Manchester (UK)
Rongbuk Glacier Rongbuk glacier in 1968 (top) and 2007. The largest glacier on Mount Everest’s northern slopes feeds Rongbuk River. El glaciar de Rongbuk en 1968 (arriba) y 2007. El glaciar más largo del Monte Everest en las laderas norte alimenta al río Rongbuk
PARKER RIVER – SLAMM MODELLING 2100 Cloughand Larsen, 2009 0.39m 1.0m