Download
1 / 53
530 likes | 698 Vues
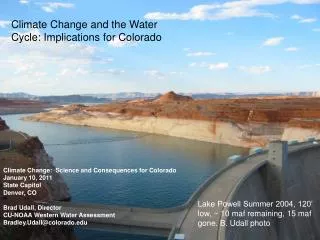
Climate Change and the Water Cycle: Implications for Colorado. Climate Change: Science and Consequences for Colorado January 10, 2011 State Capitol Denver, CO Brad Udall, Director CU-NOAA Western Water Assessment Bradley.Udall@colorado.edu.

E N D
Climate Change and the Water Cycle: Implications for Colorado Climate Change: Science and Consequences for Colorado January 10, 2011 State CapitolDenver, CO Brad Udall, Director CU-NOAA Western Water Assessment Bradley.Udall@colorado.edu Lake Powell Summer 2004, 120’ low, ~ 10 maf remaining, 15 maf gone. B. Udall photo
Outline • Water Cycle Changes • Climate Change Studies • Recent Climate • Systemic Allocation Problems • Science Issues • Systemic Reservoir Risk • Closing Thoughts Stuff and moree
Water Resource Findings from Global Change Impacts in the United States GC23B. U.S. Global Change Research Program Global Climate Change Impacts in the United States 2009 Report Brad Udall1 Roger Pulwarty2 1 Director, University of Colorado – NOAA Western Water Assessment RISA 2 Physical Scientist NOAA/Earth System Research Lab, and Director, NOAA/National Integrated Drought Information System bradley.udall@colorado.edu roger.pulwarty@noaa.gov
globalchange.gov/usimpacts This report summarizes the science and impacts of climate change in the U.S. Plain language, authoritative US Global Change Research Program report, led by NOAA Extensive review: public reviews (2), blue ribbon expert review, federal agency (GCRP) review Draws from all previous assessments, global and national (IPCC, CCSP etc) Author team was 31-members and included federal, academic and private sector experts
Climate change will stress water resources Projected Changes in Annual Runoff Change in Population from 1970 to 2008
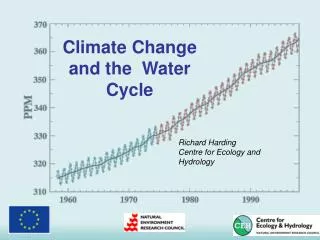
The water cycle will change in fundamental ways • The water cycle is a primary mechanism by which the Earth moves heat from areas with too much to areas with too little. • A warmer climate means more water vapor in the atmosphere - every 1F increase means 4% increase in moisture holding. • A warmer climate also means more evaporation, more precipitation GLOBALLY but regional losers. • Storm tracks expected to move northward. • Wet gets Wetter, Dry gets Drier.
Floods and Droughts will become more common Increases in Very Heavy Precipitation Days, 1958-2007 Projected Change in Precipitation Intensity – 1990s vs 2090s
Floods and Droughts will become more common • No clear national drought trend, but increasing temperatures have made droughts more severe. • Projections show longer dry periods between precipitation, especially in arid areas, mid continent and Southwest. • Northward shift in winter and spring storm tracks will reduce precipitation in some regions. Projected Change in Spring Precipitation2080-2099
Precipitation and Runoff are projected to change regionally • Precipitation and Runoff likely to • increase in Northeast and Midwest in winter and Spring • decrease in West, especially Southwest in spring and summer • Wet Wetter, Dry Drier • Summer soil-moisture reductions consistent finding Projected Change in N. American Precipitation 2080-2090 Projected Changes in Annual Runoff 2041-2060
Snow-dominated areas will experience changes • Snow is a natural reservoir • Snowpack reductions in West and Northeast already occurring at low elevations • More rain and less snow in winter • Advances in Runoff Timing in West (20 days) • and NE (14 days) already • Runoff timing projections are for up to 60-day advance in West, 14-day in East Observed and Projected Trends in Peak Streamflow Timing Changes in Snowfall Contributions to Wintertime Precipitation1949-2005
Snow-dominated areas will experience changes • Annual Runoff Pattern will change • Runoff will occur earlier (previous slide) • Lower and Warmer Flows in late summer • Some regions will see annual declines in flow (previous slide) Green River, A Tributary of the Colorado River
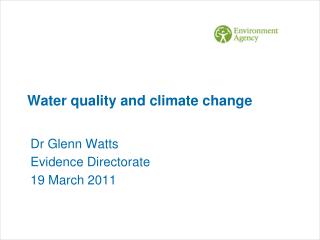
Water quality and groundwater will change • Water Quality Changes • Higher air temps = higher water temps • Higher water temps = less dissolved oxygen • = higher metabolic rates • Longer periods of summer lake stratification with no mixing of top and bottom waters • Pollution generally made worse by higher temps and lower flows • Heavy Downpours = more sediments and pathogens Lake Superior Air and Water Temperatures, 1979-2006
Water Systems are already stressed • Climate Change will place another burden on already stressed water systems • Rapid National and Regional Population Growth • Over 300m now, 420m by 2050 • West • Southeast • Aging Water Infrastructure • Enormous Backlog of needs • Sewer Overflows Common • Very expensive to fix • Many Existing Water Disputes • Bay Delta CA • Southeast • Colorado River • Great Lakes • Rio Grande Potential Water Supply Conflicts by 2025 without climate change
The past century is no longer a guide to water management • Historical Data Used to Manage Water Resources in 20thCentury • However… • Climate Change is already altering water cycle • More changes are expected • Paleoclimate studies tell us the past has been very different • Many Institutional Barriers to Change • Laws, Decrees, Compacts difficult to modify • Flood Control rule curves might require EIS to modify • Transferring ag water can be difficult • Changing Water Demands • More Research Needed • All these stresses mean water management will be doubling challenging Long-Term Aridity Changes in the West
Water and energy are linked • Energy systems use large amounts of water • Water systems use large amounts of energy • Energy Sector Use of Water… • Energy generation uses water for hydropower and for cooling water • Withdrawals of cooling water are very large, almost equal to agriculture • Water consumption by power plants is large, half that of all domestic use • Water Sector Use of Energy… • Water is heavy and takes lots of energy to heat • 4% of nation’s electricity goes to pumping, heating, treating water and wastewater • Different water sources require vastly different amounts of energy • Desalination requires large amounts of energy • Conserving water has the dual benefit of conserving energy and may reduce greenhouse gases
Outline • Water Cycle Changes • Climate Change Studies • Recent Climate • Systemic Allocation Problems • Science Issues • Systemic Reservoir Risk • Closing Thoughts Stuff and moree
Colorado River Climate Change Studies over the Years • Early Studies – Scenarios, About 1980 • Stockton and Boggess, 1979 • Revelle and Waggoner, 1983* • Mid Studies, First Global Climate Model Use, 1990s • Nash and Gleick, 1991, 1993 • McCabe and Wolock, 1999 (NAST) • IPCC, 2001 • More Recent Studies, Since 2004 – RANGE -5% to -45% BY 2050 • Milly et al.,2005, “Global Patterns of trends in runoff” • Christensen and Lettenmaier, 2004, 2006 • Hoerling and Eischeid, 2006, “Past Peak Water?” • Seager et al, 2007, “Imminent Transition to more arid climate state..” • IPCC, 2007 (Regional Assessments) • National Research Council Colorado River Report, 2007 • McCabe and Wolock, 2007, “Warming may create substantial water shortages…” • Barnett and Pierce, 2008, “When will Lake Mead Go Dry?” • Barnett and Pierce, 2009, “Sustainable Water Deliveries From CR in changing climate • Rajagopalan, 2009, “Water Supply risk on the CR: Can management mitigate?” • Comments and Responses to B&P 2008 Stuff and m
At Least 7 Colorado River Studies Since 2004… ….Runoff Declines Range from -6% to -45% by 2050 ....Best guess now -10% to -20% by 2050
Precip and Temp at 2100 A1B –7F = 3-4C Rise Precip Winter Precipitation Summer Temperatures Stuff and m
Hadley Cells 101 • George Hadley, 1700s • Simple Theory Explains • N-S movement of air near equator • Trade winds blow from NE/SE • Deserts at 30 N/S Latitude • Areas of heavy rain at Equator • Location of “Subtropical Jet” • Note: major UK Modeling Center named after Hadley
Outline • Water Cycle Changes • Climate Change Studies • Recent Climate • Systemic Allocation Problems • Science Issues • Systemic Reservoir Risk • Closing Thoughts Stuff and moree
Note: 2001, 2002, much less than average (green line), others not that low or above average
Note: Temps average about 1.6 F warmer than long-term mean (green)
Note: Red Circle Denotes the most serious gaged 10-year drought on the river ever at 80% of mean flow.
Colorado River Ten-Year Droughts Since 1906 at Lees Ferry Take Home Message: This is by far the most serious 10-year drought in the historic record Stuff and moree
Lee Ferry Flow in Acre-feet By Year Since 2000 as % of Average Stuff and moree
Title Slide Photo 2007 Shortage Sharing Agreement Signed
1100’ = ~ 11.5maf 1075’ = Short 1 (333 kaf) = ~ 9.4 maf Average Loss per month for ~120 months is 110,000 af Total Loss = 13.5 maf 1050’ = Short 2 = 417 kaf ~ 7.5 maf Thext ss 1025’ = Short 3= 500 kaf ~5.8 maf With projected flow, Powell stays same, Mead drops another 1maf by 2011 1000’ = Las Vegas Lower Intake ~4.3 maf
Outline • Climate Change Studies • Recent Climate • Systemic Allocation Problems • Science Issues • Systemic Reservoir Risk • Lessons from Australia • Closing Thoughts Stuff and moree
A Current Problem in the Lower Basin • Avg Lake Mead Inflows = 9.0 maf • 8.23 maf from Powell (Current Operating Rules) • 0.77 maf tributaries below Powell • 9 maf is all the LB is legally entitled to • Avg Lake Mead Outflows = 10.4 maf • 7.5 maf LB States (4.4 CA, 2.8 AZ, 0.3 NV maf) • 1.5 maf Mexico • 1.4 mafEvap + Delivery Losses • Net Balance = -1.4 maf/year • (Mead at 11.5 maf now) Stuff and moree
A Lurking Problem in the Upper Basin • How Much Water Left to Develop? • Current uses: ~4.5maf per year • At 13.5 mafavg , ~0.5 maf left to develop • At 15.0 mafavg, ~1.5 maf left to develop • ‘Hydrologic Leftovers’ Creates Uncertainty • Upper Basin Compact penalizes for overuse, but only determined after the fact • Terror over Compact ‘Call’ Ramifications Stuff and moree
How much water to Develop ? Source: State of Colorado “CRWAS” Study Stuff and moree
Outline • Water Cycle Changes • Climate Change Studies • Recent Climate • Systemic Allocation Problems • Science Issues • Systemic Reservoir Risk • Closing Thoughts Stuff and moree
14.4% 16.1% 9.9% 24.9% 14.1% 6.3% 2.4% 11.8% Reconciling Year 1- Scale Matters • Most runoff comes from small part of the basin > 9000 feet • Runoff Efficiency Varies Greatly from ~5% (Dirty Devil) to > 40% (Upper Mainstem) • You can’t model the basin at large scales and expect accurate results • GCMs (e.g. Milly) and H&E 2006 likely overstate declines % Total Runoff
Reconciling Year 1- Scale Matters • Most runoff comes from small part of the basin > 9000 feet • Very Little of the Runoff Comes from Below 9000’ (16% Runoff, 87% of Area) • 84% of Total Runoff Comes from 13% of the Basin Area – all above 9000’ % Total Runoff Runoff Basin Area
New Dust on Snow Research • Dust on Snow absorbs lots of solar energy • Melts Faster • Reduces Runoff
Demand Issues • Total Demand Increases by 150kaf to 500 kaf at 2040. Average Increase ~ 20%. 18 Days Longer Growing Season • At 2070 Average Increase ~30%, 30 Days. Source: State of Colorado “CRWAS” Study
Wild Cards: Pine Beetles Raffa et al, 2008
Outline • Climate Change Studies • Recent Climate • Systemic Allocation Problems • Science Issues • Systemic Reservoir Risk • Lessons from Australia • Closing Thoughts Stuff and moree
When Will Lake Mead Go Dry?Water Resources Research, 2008, Barnett and Pierce • Water Budget Analysis • One 50 maf reservoir, increasing UB demands (13.5 in 2008 ->14.1 maf/yr in 2030, 15 maf /yr inflows, current starting contents • Linear Climate Change Reduction in Flows w/ some natural variability • Results With Linear 20% Reduction in mean flows Over 50 years • 10% Chance Live Storage Gone by 2013 • 50% Chance Live Storage Gone by 2021 • 50% Chance Loss of Power by 2017 • Problems • 1.7 maf/year fixed evaporation plus bank storage • Missing 850 kaf/yr inflows below Lees Ferry • Reservoirs can and do recover, even with declining flows • Critical Issues Regardless of these Results • System is close to Demand = Supply which has big implications • Normal climate variability can push us over the edge without climate change Stuff and m
Risk of Reservoir Drying 2009 to 2057 – Can Management Mitigate? 10% flow reduction 20% flow reduction No Climate Change Risk less than 10% at 2057 Risk ~25% at 2057 Risk ~50% at 2057 • 5 Future Management Alternatives (colored lines above) • Near-term risks relatively low • Management can offer some risk mitigation • 2057 results for -10% and -20% are unacceptable (Rajagopalan et al, 2009)
Common to Studies • On a collision course between supply and demand • When collision occurs is the real question • It all depends on starting conditions… • If Assume Deficit now, then problems very soon • If no deficit now then more time • There is a broad envelope of risk to consider • This is the key lesson for the 21st Century – • How do we build resilient systems???