Download
1 / 41
410 likes | 636 Vues
Implications of Climate Change for the Hydrology and Water Resources of the Colorado River Basin. Niklas S. Christensen. Colorado River Basin. Covers 630,000 km 2 lies in parts of 7 states & Mexico Drains into Mexico & Gulf of California Heavily allocated. Research Overview.

E N D
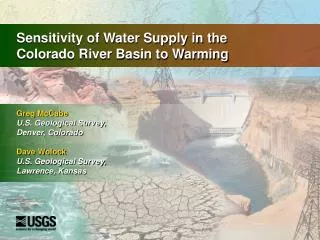
Implications of Climate Change for the Hydrology and Water Resources of the Colorado River Basin Niklas S. Christensen
Colorado River Basin • Covers 630,000 km2 • lies in parts of 7 states & Mexico • Drains into Mexico & Gulf of California • Heavily allocated
Research Overview • Utilized a climate model output to get a temperature and precipitation signal in Colorado River Basin through 2100 • Input this temperature and precipitation into a hydrology model to get corresponding streamflows through 2100 • Input these future streamflows into a reservoir model to analyze how well the system would perform through 2100
Global Circulation Models • Coupled atmosphere - land - ocean system • mathematical representation of earth’s physical processes • spatial resolution typically 3° lat./long. • ~ 20 - 40 layers in ocean and atmosphere
PCM runs consist of: • 3 runs going out to 2098 using IPCC business-as-usual emission scenarios and corresponding atmospheric CO2 concentrations • Control Run: based on static 1995 CO2 concentrations • Historic run: based on pre-industrial revolution CO2 concentrations • results of ‘future’ BAU runs are summarized into; • Period 1: 2010-2039 • Period 2: 2040-2069 • Period 3: 2070-2098
PCM Projected Colorado R. Temperature Timeseries Annual Average ctrl. avg. hist. avg. Period 1 2010-2039 Period 2 2040-2069Period 3 2070-2098
PCM Projected Colorado R. Precipitation Timeseries Annual Average hist. avg. ctrl. avg. Period 1 2010-2039 Period 2 2040-2069Period 3 2070-2098
Natural Flow at Lee Ferry, AZ allocated20.3 BCM Currently used 16.3 BCM
Approach • create timeseries of future temperature & precipitation from PCM(climate model) for input to the hydrology model • calibrate/validate hydrology model on historic record then run with future input to obtain probable streamflows • create reservoir model, validate on historic record, use to analyze how the Colorado River water management system will perform with future inflows
bias-corrected climate scenario from NCDC observations month m month m raw climate scenario from PCM historical run Bias Correction and Downscaling For future climate runs, temperature trend (relative to observed run) removed before, and replaced after, bias correction step
TOBS 1. 2. 3. TGSM Bias Correction and Downscaling 1) bias correction climate model climatology observed climatology 2) spatial interpolation PCM (~2.8 deg.) VIC (1/8 deg) 3) temporal disaggregation (via resampling of observed patterns) monthly daily
Sub Basins Calibration 1. Duchesne R. (nr Randall, UT) 2. Upper Colorado R. (at Cameo, CO)3. Gunnison R. (at Grand Junction, CO)4. San Juan R. (at Bluff, UT)5. Green R. (at Green River, UT)6. Colorado R. (at Lee Ferry, AZ)7. Colorado R. (at Imperial, AZ) 5 1 2 3 6 Parameters used in model calibration 4 7 • Non-linear baseflow recession curve • Ws, Ws(max), Ds, Ds(max) • Variable Infiltration Curve parameter • Binf • Soil Depths, snow roughness
Annual Average Hydrograph Simulated Historic (1950-1999)Period 1 (2010-2039)Control (static 1995 climate)Period 2 (2040-2069)Period 3 (2070-2098)
Projected Spatial Change in Runoff 90 %86 %82 %83 %
CRRM • Historic Streamflows to Validate • Projected Inflows to assess future performance of system • Basin storage aggregated into 4 storage reservoirs • Lake Powell and Lake Mead have 85% of basin storage • Monthly timestep • Reservoir evaporation = f(reservoir surface area, mean monthly temperature) • Hydropower = f(release, reservoir elevation) Storage ReservoirsRun of River Reservoirs
Water Management Model (CRRM) • Multi Species Conservation Program year 2000 demands • upper basin 5.4 BCM • lower basin 9.3 BCM • Mexico 1.8 BCM • Minimum Annual Release from Glen Canyon Dam of 10.8 BCM • Minimum Annual Release from Imperial Dam of 1.8 BCM
Annual Releases to the Lower Basin target release
Annual Releases to Mexico target release
Conclusions (1 of 2) Average discharge when Colorado …………….. . 23 BCMRiver Compact signed Allocated for consumptive use …………….. 20.3 BCM Since then, average flow closer to ………….. 20.5 BCM Currently consumptive uses ………………. 17.1 BCMplus evaporation losses (1 - 2 BCM) = 18 - 19 BCM Control run (1995 climate) streamflow …………. 17.9 BCM Period 1, 2, 3 streamflow ………… 16.9, 16.0, 16.2 BCM
Conclusions (2 of 2) Increased storage capacity will not help If PCM predicted climate is correct, there will be significant water resource implications for the Colorado River Basin