Download
1 / 38
390 likes | 581 Vues
Bruce Peachey, P.Eng., MCIC President, New Paradigm Engineering Ltd. U of A - Chem Eng Student Night March 23, 2004. Water Balances and Climate Change. Areas to Cover. Chemical Engineers and Climate Change Global Water Balance North American Water Use and Impacts

E N D
Bruce Peachey, P.Eng., MCICPresident, New Paradigm Engineering Ltd.U of A - Chem Eng Student NightMarch 23, 2004 Water Balances and Climate Change
Areas to Cover • Chemical Engineers and Climate Change • Global Water Balance • North American Water Use and Impacts • Evidence for Regional Water Impacts • Evidence for Local Water Impacts • Our Role for the Future
Chemical Engineers & Climate Change • Edmonton Section meetings on Climate Change • Jan, 1998 - Kyoto impacts discussed • May, 2000 - Proposed 7 potential sources of climate change • Feb, 2002 - New IPCC data review supported Human Enhanced Water Evaporation (HEWE) as the most likely • 2002 Discussion Paper Circulated • Dec, 2003 Presentation to CMOS
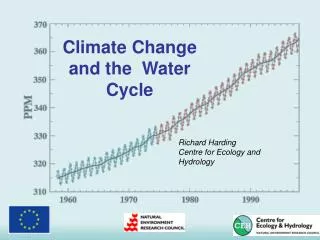
Water Balances and Climate Change • Familiar to chemical engineers • Climate changes mainly water and energy • Air can’t carry much energy without water • Proposed that Human Enhanced Water Evaporation (HEWE) rather than GHG Warming is the main cause of Climate Change • Water Balances can potentially be used to prove which theory is correct
Global Water Cycle (km3 x 103/yr = Tt/yr) Source: Global Warming – The Complete Briefing – John Houghton 40 71 111 425 385 Land Ocean 40
Latest Data Indicates • Globally atmospheric GHGs are up • Globally average temperatures are higher • Northern Hemisphere higher especially last 10 years • Night-time lows increasing more than day-time highs • More over land than over oceans. • Cooling in some areas of southern hemisphere and Antarctica • Growing Season – Increase by 1 to 4 days per decade in northern hemisphere
Latest Data Indicates • Precipitation increases (5-10%) over most land areas in mid to high latitudes of Northern Hemisphere • No observed increase in southern hemisphere • Correlated to increases in clouds and extreme weather. • Heavy precipitation events increased in northern latitudes • Likely a 2 to 4% increase in the frequency of heavy precipitation events in last 50 years in Northern Hemisphere
Latest Data Indicates • Atmospheric Water Vapour Increased in Northern Hemisphere by several percent per decade • Cloud cover in Northern Hemisphere increased by 2% • Positively correlated with decrease in diurnal temperature range (night-time warming)
Latest Data Indicates • Sea-Ice in Northern Hemisphere decreasing • No trends in Antarctic sea ice apparent. • Non-polar glaciers – Widespread retreat except in coastal areas. • El Nino Events – More frequent, persistent and intense over the last 30 years
The Big Question? • Where did all the extra water come from??????? • GHG Warming of Oceans? • HEWE on Land? • Somewhere else???
Water Balance just GHG Warming? +42 - 38 +4 +4 40 71 111 425 385 Land Ocean 40 Oceans should be affected the most +4
Closing the Balance with HEWE 40 +4 71 111 425 385 +4 Land Ocean Land should be affected the most 40
World Precipitation Trend = +2% avg since 1900; = +2000 Gt/yr avg over 100 years Source: IPCC Scientific Report
Annual Global Water Withdrawals Source: Scientific American – February 2001 – Peter H. Gleick =+2% Increase avg precip over the last 100 years Original Chart showed cubic miles x 4.6 to get cubic kilometers
Northern Hemisphere Mid-Latitude Water Vapour Concentrations1981-1994 Oltmans and Hoffman, Nature, 375 (1995)
How Does HEWE Theory Fit the Facts? • Source is anthropogenic and increasing • Should cause increased warming in cold areas. • Should cause increased rainfall and severity of storms Unusual patterns • Increases night time low temperatures due to day/night cycling as dew point is raised
580 710 328 610 709 174 30 128 14 World Water Withdrawals = 3414 Gt/yr + 25% evap. from dams Source: World Resources Institute 2003
Feeding Antarctic Ice Loss?Antarctic Peninsula - Sciam Dec’02 “The only part of Antarctica certain to have been affected by global warming” Irrigation In SA • Feeding energy and water onto the peninsula? • Only 1000km and carried by prevailing winds and ocean currents No Effect - Stable for 15 million years Ice sheet has disappeared at least once in 600,00 yrs
North American Water Use • Mainly Used for Power Generation in the U.S. and Canada; followed by Irrigation • Patterns of water use vary by region • Amount of Natural Renewable Water Resource Withdrawals • Canada - 1.4% • United States - 25.6% • Mexico - 18.1% • (NB Not including water reservoir evaporation)
Regional Indicators of Water Impacts • Weekend rainfall (Cerveny and Balling 1998) • Rainfall 22% higher on Saturdays on East Coast • Lowest on Sunday to Tuesday • Workweek temperature effects (Forster and Solomon 2003) • Diurnal Temperature Ranges weekly variations • Three days after 9/11 - Lower night time temperatures • Attributed to radiative impacts of airplane contrails • However, other things were also not happening
The Heat Pipe Effect Day/Night Cycles Water gives Up Heat and Falls In Cold Areas Water Transport Water added in Hot Dry Areas
Workweek Effects - Forster and SolomonSciam September 16, 2003 Red - Night-time temperatures lower on weekdays Blue - Night-time temperatures lower on weekends Air can travel 1000’s km/day. Water molecule on average spends 10 days in the air Work Week Water Pulse? Time delay in the heat pipe?
Canadian Water Use - 1996Total = 44.72 Gt/yr = 1.4% of Supply NB Hydroelectric supplies 62% of energy demand
2.8 3.5 3.8 6.5 Atlantic Quebec Ontario Prairies B.C. 28.3 Water Withdrawals by Province (Gt/yr) NB Does not include evaporation from hydroelectric reservoirs
Summer Water Pulse? Feeding Energy to Melt the Glaciers & Warm/Dry Out the Prairies? N.B. 44% of Alberta’s and 30% of B.C.’s water use on an annual basis is for Irrigation - But all of it is emitted in the summer months! 5 Gt/yr
1 tonne of water vapour condensing to water can melt 6.7 tonnes of snow or ice
Alberta Water Balance? Precipitation = 337 Gt/yr Evaporation = 261 Gt/yr • Alta Water Use: • 9.4 Gt/yr + res evap • 16+% of Avail • 80% of Avail in North • <20% of use is in North • Alta uses 50% of water • In S. Saskatchewan River Net Surface Runoff Added = 61 Gt/yr River Flows In = 70 Gt/yr River Flows Out = 131 Gt/yr Source: Alta Env David Trew March 22, 2004 *Groundwater Recharge???? = 15 Gt/yr
Local Effects? - Lightning “Bright Sky, Dirty City?” Sciam May 2001 • Increased lightning in areas centered on large refining complexes. • Attributed to pollution seeding cloud formation • But…Largest emission from refineries is water vapour
This is definitely water! Do nuclear plants cause lightning as well?
The Balance of Evidence - Says... • Human Enhanced Water Evaporation (HEWE) SHOULD BE THE major factor in Climate Change Equation • GHG impacts may still be a concern and are an indicator of energy waste so should still be reduced by reducing energy use • Finding the right solutions means addressing the right problem.
HEWE – Implications • Agriculture Industry • Improvements needed in irrigation practices • Select crops that suit the local climate • Electrical Power Industry • Reduce power use; S/D nuclear (206 vs. 140 l/kw-hr) • Increase efficiency from 40% to 80% with cogen • Reduce Water Use • Some responses to GHG make HEWE worse • Dams, water transfers south, biomass energy, nuclear power
Does It Matter Which Theory is Right? • Likely no theory is entirely right. • Best strategy is to find “Robust Solutions” which: • Minimize Water added to atmosphere • Reduce Energy Waste Fossil Fuel Consumption Reduce GHG emissions • Create Wealth (improve standard of living - current and future)
New Paradigms? Not Really • Sustainable Development is based on: • Reduce • Waste of energy, water and other resources on trivial wants so they are there when future generations need them. • Reuse – Resources more than once • Recycle – If you can’t do the first two. • Replace – Feel good placebo in last place. Wasting “Renewable” Power is still a waste of resources • Is it really green?
The Challenge for ChemE’s • Lobby to get someone studying Human Enhanced Water Evaporation impacts on climate and local weather (CMOS?) • Encourage discussing HEWE in public forums or with governments • Ensure the right actions are taken rather than the politically correct or expedient ones • "Difference of opinion leads to inquiry, and inquiry leads to truth" - Thomas Jefferson
Contact Information New Paradigm Engineering Ltd. 10444 - 20 Avenue Edmonton, Alberta Canada T6J 5A2 tel: 780.448-9195 email: bruce@newparadigm.ab.ca web: www.newparadigm.ab.ca