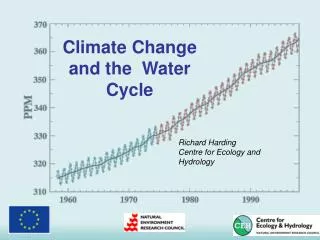
Climate Change and the Water Cycle
160 likes | 387 Vues
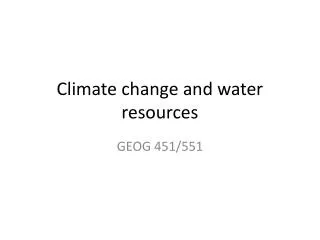
Climate Change and the Water Cycle . Richard Harding Centre for Ecology and Hydrology. Drivers of Global Change: Increasing population Increasing water consumption Land cover/use change Increasing greenhouse gases . Stern Review (2006 ). 2000. 1500. 1000. 500. 0.

Climate Change and the Water Cycle
E N D
Presentation Transcript
Climate Change and the Water Cycle Richard Harding Centre for Ecology and Hydrology
Drivers of Global Change: • Increasing population • Increasing water consumption • Land cover/use change • Increasing greenhouse gases
2000 1500 1000 500 0 1900 1920 1940 1960 1980 2000 2020 2040 3000 Assessment 2500 /year Agriculture 3 Forecast Industry Municipal Consumption, km needs Reservoir Total Water Consumption - after Shiklomanov2000
To predict the future we need the climate models • We represent the earth by a grid of squares, typically of length 150 km or smaller. • The atmosphere and oceans are divided into vertical slices of varying depths.
FIGURE SPM-6. Relative changes in precipitation (in percent) for the period 2090–2099, relative to1980–1999. Values are multi-model averages based on the SRES A1B scenario for December to February (left) and June to August (right). White areas are where less than 66% of the models agree in the sign of the change and stippled areas are where more than 90% of the models agree in the sign of the change. IPCC 2007
Increases Decreases Land precipitation is changing significantly over broad areas Smoothed annual anomalies for precipitation (%) over land from 1900 to 2005; other regions are dominated by variability.
UK winter Climate change scenarios – the changing seasons • Wetter: Up 10% by 2020s, up to 30% by 2080s • UK summer • Drier: 20% by 2020s, up to 50% by 2080s
Climate change scenarios – impact on flows Percentage change in flows for the 20-year return period
1978 1996 Glacier melt in the Himalayas 1989 2000 10km
SAGARMATHA: Snow and Glacier Aspects of Water Resources Management in the Himalaya %change in decadal mean flow for Ganges from regional climate model output (RCM2) http://www.nwl.ac.uk/ih/www/research/SAGARMATHA/
The WATCH Integrated Project: • 25 European partners: hydrology, climate and resource scientists • 13m euros of effort • International programme • research, workshops, training, dissemination