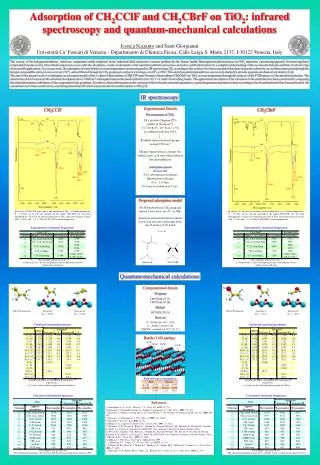
IR-spectroscopy
IR-spectroscopy. Dr. Karin Habermehl-Cwirzen. IR was recognized as a distinct region of the energy spectrum by Sir William Herschel, an astronomer, when he measured the heating effect of sunlight (Herschel 1800).

IR-spectroscopy
E N D
Presentation Transcript
IR-spectroscopy Dr. Karin Habermehl-Cwirzen
IR was recognized as a distinct region of the energy spectrum by Sir William Herschel, an astronomer, when he measured the heating effect of sunlight (Herschel 1800). However, the field of IR spectroscopy - the study of wavelengths of light in the IR region of the spectrum and their interaction with various materials - did not develop at that time due to difficulties in building suitable detectors to measure IR-radiation. Eventually, beginning in 1903, William W. Coblentz conducted comprehensive experiments leading to the accurate measurement of IR spectra for hundreds of inorganic and organic compounds Interest increased in the potential of IR spectroscopy for analytical chemistry when the first prototypes of IR spectrometers were built in the 1930s. IR spectroscopy helps to identify structural groups > structure of the molecule
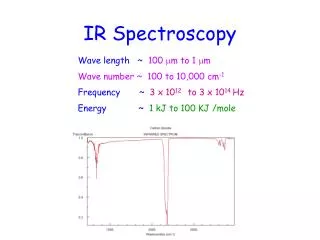
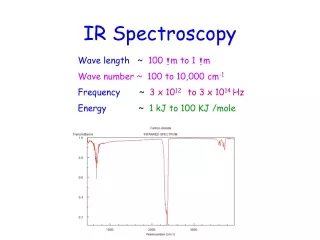
IR spectrum is the transmission of the IR-radition as a function of the wavelength/ wavenumber Far-infrared, 500-20 cm-1 Mid-infrared: 4000-500 cm-1 mostly used in IR spectroscopy Near-infrared:14000-4000 cm-1
The two different ways to show an IR spectrum: Adsorption Transmission The region to the right-hand side of the diagram (from about 1500 to 500 cm-1) usually contains a very complicated series of absorptions. These are mainly due to all manner of bending vibrations within the molecule. This is called the fingerprint region.
IR spectrum At RT most bonds will vibrate with the lowest energy, but if radiation with the right frequency is applied, the bond can adsorb the energy and vibrate with a greater amplitude. Most bonds adsorb in the IR region. All bonds absorb a special frequency and therefore the bond can be identified. As molecules often contain a number of bonds, with many possible vibrations, an IR spectrum can have many absorptions. Identifying again via tables or by matching the spectrum to database spectra. If the spectrum of a molecule has already been recorded on a database, any spectrum produced can be compared to that database to help identify the molecule.
Because there are needs to be a relative scale for the absorption intensity, a background spectrum must also be measured. This is normally a measurement with no sample in the beam. This can be compared to the measurement with the sample in the beam to determine the “percent transmittance.” This technique results in a spectrum which has all of the instrumental characteristics removed. Thus, all spectral features which are present are strictly due to the sample. Infrared spectra may be obtained from samples in all phases (liquid, solid and gaseous). Liquids are usually examined as a thin film sandwiched between two polished salt plates (note that glass absorbs infrared radiation, whereas NaCl is transparent). If solvents are used to dissolve solids, care must be taken to avoid obscuring important spectral regions by solvent absorption. Perchlorinated solvents such as carbon tetrachloride, chloroform and tetrachloroethene are commonly used. Alternatively, solids may either be incorporated in a thin KBr disk, prepared under high pressure, or mixed with a little non-volatile liquid and ground to a paste (or mull) that is smeared between salt plates.
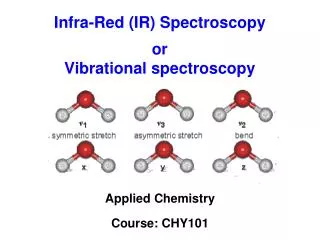
water molecule The bonds within molecules all vibrate at temperatures above absolute zero. There are several types of vibrations that cause absorptions in the infrared region. Probably the most simple to visualise are bending and stretching.
Type of Vibration The energy absorbed when particular bonds vibrate depends on several factors. You can think of a bond as a spring between two atoms. Imagine trying to bend or stretch the spring. Generally it is easier to bend than stretch, so bending vibrations are of lower energy than stretching vibrations for the same bond. Therefore, absorptions due to bending tend to occur at lower wavenumbers than stretches. Strength of Bonds You can think of a strong bond as a stiff spring. This will need more energy to make the ‘spring’ bond vibrate, so stronger bonds absorb at higher wavenumbers. Mass of Atoms Finally the atoms in the bond can be thought of as masses at the end of the spring. Heavy masses on a spring vibrate more slowly than lighter ones. We can imagine that heavier atoms vibrate at a lower frequency than lighter ones. Therefore you would expect a C-Br bond to absorb at a lower frequency than a C-Cl bond as bromine is heavier than chlorine.
The fact that a molecule vibrates does not in itself insure that the molecule will exhibit an IR spectrum. For a particular vibrational mode to absorb infrared radiation, the vibrational motion associated with that mode must produce a change in the dipole moment of the molecule. HCl, for example, with a center of positive charge at the H atom and a center of negative charge at the Cl atom, has a dipole moment. The magnitude of the dipole moment changes as the HCl bond stretches, so this vibration absorbs IR radiation. We say that the vibration is IR active. The N2 molecule, on the other hand, has no dipole moment. Further, stretching the N-N bond does not produce a change in dipole moment, so the vibration is infrared inactive (i.e., cannot directly absorb IR radiation). It is important to realize that there are many molecules that, although possessing no permanent dipole moment, still undergo vibrations that cause changes in the value of the dipole moment from 0 to some non-zero value. An example is CO2
Carbon dioxide and IR If carbon dioxide was perfectly still it would not have a permanent dipole moment as its charge would be spread evenly across both sides of the molecule. However the molecule is always vibrating and when it undergoes an asymmetric stretch, an uneven distribution of charge results. This gives the molecule a temporary dipole moment, enabling it to absorb infrared radiation. Hence even some molecules without a permanent uneven distribution of charge can absorb IR radiation.
DIPOLE MOMENTS Only bonds which have significant dipole moments will absorb infrared radiation. Bonds which do not absorb infrared include: • Symmetrically substituted alkenes and alkynes • Many types of C-C Bonds • Symmetric diatomic molecules H-H Cl-Cl
STRONG ABSORBERS d- The carbonyl group is one of the strongest absorbers d+ Also O-H and C-O bonds infrared beam
IR has often been referred to as a carbonyl group indicator. A carbonyl is a C=O, and shows a very long and distinct peak between 1600-1800 cm-1.
What an infra-red spectrum looks like A graph is produced showing how the percentage transmittance varies with the frequency of the infra-red radiation. In the diagram, three sample absorptions are picked out to show you the bond vibrations which produced them. Notice that bond stretching and bending produce different peaks in the spectrum. Each peak is caused because energy is being absorbed from that particular frequency of infra-red radiation to excite bonds in the molecule to a higher state of vibration - either stretching or bending.
Using the fingerprint region Compare the infra-red spectra of propan-1-ol and propan-2-ol. Both compounds contain exactly the same bonds. Both compounds have very similar troughs in the area around 3000 cm-1 - but compare them in the fingerprint region between 1500 and 500 cm-1. The pattern in the fingerprint region is completely different and could therefore be used to identify the compound.
One thing to remember with IR spectroscopy for organic chemistry is that you will always have carbon involved in your molecule. Because carbon is usually bond to hydrogen, you should always expect to see a peak around the 3000 cm-1 region of the spectrum. For sp3 carbon bonds (C is bonded to 4 atoms), this peak occurs below 3000cm-1; for sp2 (C is bonded to 3 atoms) and sp carbon (C is bonded to 2 atoms) bonds, this peak occurs above 3000cm-1. Evidence for the presence of a benzene ring is the “four fingered region” which can be located around the 1600-2000 cm-1 region. It is called the four fingered region because there are generally 4 short peaks right next to each other.
The infra-red spectrum for an alcohol Ethanol The O-H bond in an alcohol absorbs at a higher wavenumber - somewhere between 3230 - 3550 cm-1. In fact this absorption would be at a higher number still if the alcohol isn't hydrogen bonded - for example, in the gas state. Notice the absorption due to the C-H bonds just under 3000 cm-1, and also the peaks between 1000 and 1100 cm-1 - one of which will be due to the C-O bond.
Hexane CH2 rocking CH3 bend CH2 bend CH stretch When interpreting an IR spectrum, look for evidence of all the functional groups that are present and all that are not, e.g. OH groups source: http://www.chem.wwu.edu/pavia/c352ppt.html
Example Wood, which was exposed to fungi for different durations up to 12 weeks, with decay assessed through weight loss and FTIR. The relative changes in intensities of spectral bands associated with lignin and carbohydrates as a result of decay were determined after different exposure periods. IR is a useful technique for studying wood decay chemistry, since minimal sample preparation is required and very small quantities of wood can be analysed (a few milligrams). IR has previously been used for analysing chemical changes that occur in wood during weathering, decay and chemical treatments,
(a) IR spectra of Scots pine samples with various degrees of decay: (a) undecayed wood; (b) decayed for 2 weeks; (c) decayed for 4 weeks; (d) decayed for 6 weeks; (e) decayed for 8 weeks; (f) decayed for 10 weeks and (g) decayed for 12 weeks.
IR and building materials (beside wood) The major raw materials used for cement manufacture are limestone, shale and siliceous materials, laterite, bauxite, sandstone, etc. These materials contain a variety of minerals in different forms. IR spectroscopy has been found to be very useful in identifying most of these minerals. The vibrational frequencies of these modes for the species under study vary considerably, depending on parameters such as molecular structure, chemical bonds, crystal forms, impurities in solid solution, etc.
Kaolin, Red Clay, Black Cotton Soil, and White Clay The spectrum of kaolin is characterized by bands in the 3600 cm-1region (hydroxyl stretching), at 1150 to 960 cm-1 (Si-O stretching region), and below 960 cm-1 (bending and lattice modes) (Fig. 6). The spectrum of white clay shows a broad and unresolved band in the Si-O, stretching band appears and at 1070 cm-1 (white clay). For red clay at 1025 cm-1
Gypsum (Fig. 7) is identified by the bands at 1140, 668, and 602 cm-1.
The spectrum of the fly ash sample is not well defined (Fig. 8). The presence of bands in the region 800 to 600 cm-1 can arise from the presence of sillimanite and mullite. The bands at 1137, 625 and 476 cm-1 are assigned to mullite and the strong band at 800 cm-1 is related to an amorphous aluminosilicate phase.
The spectrum ( Fig. 9) of blast furnace slag indicates the amorphous nature of the material (broad bands), The same slag, crystallized in the laboratory
Studies have been carried out on the ancient gypsum mortars taken from an old church St. Engracia, with the help of IR spectroscopy. Three broad groups of repair materials were identified. Spectral lines corresponding to gypsum, carbonates (dolomite), silicate, and nitrates (in some samples) were observed. The presence of wax with oil or resin, or egg yolk, was also identified.
Carbonates, such as calcite (CaC03) or malachite (CuC03·Cu(OH2)),show at least one strong absorption band from C-O stretching in the region of 1550-1350 cm-l Carbonate bending vibrations produce sharp bands in theregion of 900-650 cm-l . Sulfates. Sulfates, such as gypsum (CaS04·2H20), anhydrite ( CaS04) , and barite (BaS04), show a strong S-O stretching vibration band in the region of 1 200-1050 cm-l Amorphous silica produces a strong Si-O stretching band near 1050 cm-l that has a recognizable asymmetricshape from a shoulder near 1 200 cm-l Silicates have a fully ordered crystalline lattice structure. This produces a well-defined Si-O absorption band at 1 200-800 cm-l . In layered silicates, such as kaolin, the band is split into two or more peaks
Many police forces across the world now routinely use IR, almost certainly without realising it. This is because many ‘breathalysers’ used to collect evidence to determine levels of alcohol in breath are IR spectrometers that look specifically for absorptions at around 1060 cm-1, which corresponds the vibration of the C-O bond in ethanol!