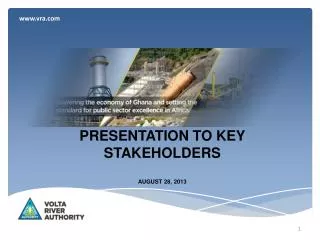
PRESENTATION TO KEY STAKEHOLDERS
PRESENTATION TO KEY STAKEHOLDERS. Executive Summary. 2012 was a financially challenging year Revenue of GHS 1.75 billion including Govt subsidy of GHS 360 million Operational loss of GHS 82 million Net loss of GHS 90 million

PRESENTATION TO KEY STAKEHOLDERS
E N D
Presentation Transcript
Executive Summary • 2012 was a financially challenging year • Revenue of GHS 1.75 billion including Govt subsidy of GHS 360 million • Operational loss of GHS 82 million • Net loss of GHS 90 million • Fair performance operationally with gradual improvement in thermal performance • Hydro availability of 96% • Thermal simple cycle availability of 82% • Steam became available in 4th quarter
Executive Summary • Erratic gas supply and eventual interruption led to drastic increase in fuel cost • Crude oil imports rose to USD 582 million from 258 in 2011 • No increase in tariff to account for higher fuel cost and depreciated currency • VRA made entry into renewables with start of construction of 2.5 MW Solar Plant • Two (2) projects ongoing • 220 MW Kpone Thermal Plant • 110 MW T2 Project
POWER SALES • Total energy sold to VRA’s customers in 2012 was 11,172 GWh. • ECG, the largest customer of VRA consumed about 7,002 GWh, representing 62.67% of the total energy sold. • Total energy supplied to VRA’s customers for 2012 increased from 10,024 GWh to 11,172 GWh, an increase of about 11.45%.
2012 FINANCIAL HIGHLIGHTS • Energy Sales increased by 58% (GH¢638.83 million to GH¢1,749.39 million) compared with previous year’s sales of GH¢1,110.56 million • Cost of Sales increased by 105% (GH¢849.90 million) from GH¢806.68 million in 2012 to GH¢1,656.58 million in 2012. • Administrative Costs increased by GH¢26.83 million (13%) to GH¢238.80 million (2011: GH¢211.97 million) • Operating Loss of GH¢82.22 million compared with a profit of GH¢140.45 million in 2011.
GENERATING STATIONS (INSTALLED CAPACITY) PLANTTotal (MW) Akosombo Hydro Generating Station 1,020 MW (6 x 170MW units) Kpong Hydro Generating Station 160 MW (4 x 40MW units) Bui Hydro Electric Plant 133 MW (Currently running 1 Unit) Takoradi Thermal Plant Station (TAPCO) (GT) 2 x 110 MW 220 MW (CCT)1 x 110 MW 110 MW Takoradi Thermal International Company (TICO) (GT) 2 x 110 MW 220 MW T3 132MW TT2PP 49.50 MW Mines Reserve Plant 80 MW Tema 1 Thermal Plant110 MW Solar 2MW Sunon Asogli Power Plant (SAPL) IPP 200 MW CENIT Power Plant IPP 110 MW Total National Installed Capacity 2546.50 MW 15
GROWTH IN ELECTRICITY DEMAND HAS ACCELERATED IN RECENT YEARS CAGR 2006 – 2010: 6% CAGR 2008 – 2010: 10%
COMMITTED GENERATION RESOURCES (2012-2015) • List of Committed Generation Resources
NIGERIA GAS SUPPLY • The average daily gas supply from Jan - August 2012 was about 61 MMscf/day. • There had been no gas supply since the accidental rupturing of the gas pipeline in late August 2012. • Gas supply resumed early August, 2013. • Discussions are on-going for additional gas of 30 MMscf/day from Nigeria. In addition to this VRA is also pursuing the use of LNG as the long term solution to gas supply challenges. • WAPCO projects more investments in Nigeria gas sector, resulting in gradual supply build-up.
GHANA’S NATURAL GAS NEED PER DAY FOR THE NEXT 10 YEARS Ghana will need between 230 MMscf/day and 850 MMscf/day of Natural Gas (for Power & Non-Power) in the next 10 years
GAS SUPPLY FROM GHANA • Jubilee gas production has started and 20 MMscf/day is being used on the FPSO. • The remainder of the gas is being re-injected. • No gas infrastructure in place to deliver gas to shore. • Gas delivery to shore is expected in 2014, with pipeline construction from the FPSO to Domunli and then to the Takoradi Thermal Power Plants • Jubilee gas available for consumption is expected to peak at about 120MMscf/day. • New gas fields discoveries expected to increase gas production.
LIQUEFIED NATURAL GAS (LNG PROJECT) VRA is exploring the supply of LNG that then gets re-gasified on a Floating Storage Re-Gasification Unit (FSRU) to supply high pressure gas directly into a consumer pipeline
SUMMARY • 2012 was a financially challenging year even though we registered continued improvement in the thermal operations • No tariff increase to cover high crude oil imports • Stable supply of gas remains highest priority. • Regulatory framework to promote sustainable capacity additions also critical. • Ghana’s geographic position and political and economic stability position must be properly leveraged.