Download
1 / 34
340 likes | 361 Vues
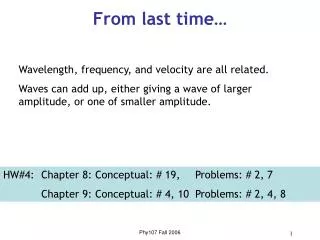
Quick summary of some things from last time: NMR data (specifically the NOE effect) can be used to measure the distances between pairs of 1 H nuclei separated by about 6 Å or less.

E N D
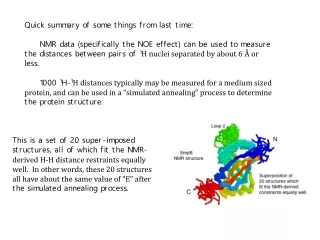
Quick summary of some things from last time: NMR data (specifically the NOE effect) can be used to measure the distances between pairs of 1H nuclei separated by about 6 Å or less. 1000 1H-1H distances typically may be measured for a medium sized protein, and can be used in a “simulated annealing” process to determine the protein structure. This is a set of 20 super-imposed structures, all of which fit the NMR-derived H-H distance restraints equally well. In other words, these 20 structures all have about the same value of “E” after the simulated annealing process.
Today’s planned topics: 1) Acquiring an NMR spectrum: Fourier transforms & FT-NMR. 2) Solving the “spectrum assignment problem”.
Obtaining an NMR spectrum: a simple (but inefficient) way. Put nuclei in magnetic field. For 1H (with I=1/2) there are two allowed energy states: You could irradiate sample with radio waves, and there will be absorption when the energy of the radio wave matches the energy difference between the two allowed energy states. You would need to scan the frequency spectrum, one frequency at a time: This is one way to get an NMR spectrum. It is not very efficient, but it would work!
To obtain an NMR spectrum of a protein, you could measure the absorption of radio waves, one frequency at a time:
A much more efficient way to get an NMR spectrum uses a “Fourier transform” method. What is a Fourier transform?
Converts the time-varying signal into its frequency spectrum.
Converts the time-varying signal into its frequency spectrum.
Notice that the entire NMR frequency spectrum is obtained by recording the time-varying signal for 0.5 seconds!
For FT-NMR, it is necessary to identify a time-varying signal that can be measured and Fourier transformed to yield the NMR frequency spectrum.
Typical time-varying signal from a protein, where the different nuclei have many different NMR frequencies: 90 degree pulse, then record f(t): Notice that the entire NMR frequency spectrum is obtained by recording the time-varying signal for 0.5 seconds!
For multi-dimensional NMR, 2 time varying signals are recorded, and Fourier transformed is used two times to generate the 2-D NMR spectrum.
Today’s topics: 1) Acquiring an NMR spectrum: Fourier transforms and FT-NMR. 2) Solving the NMR spectrum assignment problem.
An example of a protein structure determination by NMR (including solving the spectrum assignment problem). NMR analysis of a protein called “Antizyme”, an inhibitor of the enzyme ornithine decarboxylase (ODC). Antizyme binds and inhibits ODC, and targets ODC for degradation.
A section of the 2-D NOE spectrum of Antizyme.
First step of NMR analysis of Antizyme is spectrum assignment: (Identifying the NMR frequencies of as many specific nuclei in the protein as possible). 3-dimensional “triple-resonance” FT-NMR is used for solving the assignment problem.
3-D “HNCA” spectrum. C 3-D spectrum, with H on first axis, 13Ca on 2nd axis, and 15N on 3rd axis. H N15 = 125.5 ppm plane
Eventually generate a table of the NMR frequencies of (almost) all the nuclei in the protein:
Structure determination is performed using Nuclear Overhauser Effect (NOE) spectra, to find protons that are near each other in the structure.
3-D NOE spectrum. N 125.7 ppm ppm ppm ppm ppm N15 = 125.7 ppm plane
125.7 ppm
Results after simulated annealing, using 1400 NMR-derived restraints:
Once the structure of Antizyme is known, how do you identify candidates for which parts of the protein are functionally important? (In this case, “functionally important” may mean binding and inhibiting the enzyme Ornithine Decarboxylase).
Blue = conserved, inside protein ; Red = conserved, on surface of protein.
Structure, plus locations of conserved amino acids, leads to hypotheses regarding which a.a. may be directly involved in binding to ornithine decarboxylase.