Download
1 / 6
60 likes | 82 Vues
The Integrated Multi-satellite Retrievals for Global Precipitation Measurement (IMERG) dataset provides comprehensive precipitation rates every 30 minutes worldwide. This update extends the data to the TRMM era and polar regions, offering improved accuracy and coverage. A long-term analysis demonstrates how the latest Version 06B compares to established datasets.

E N D
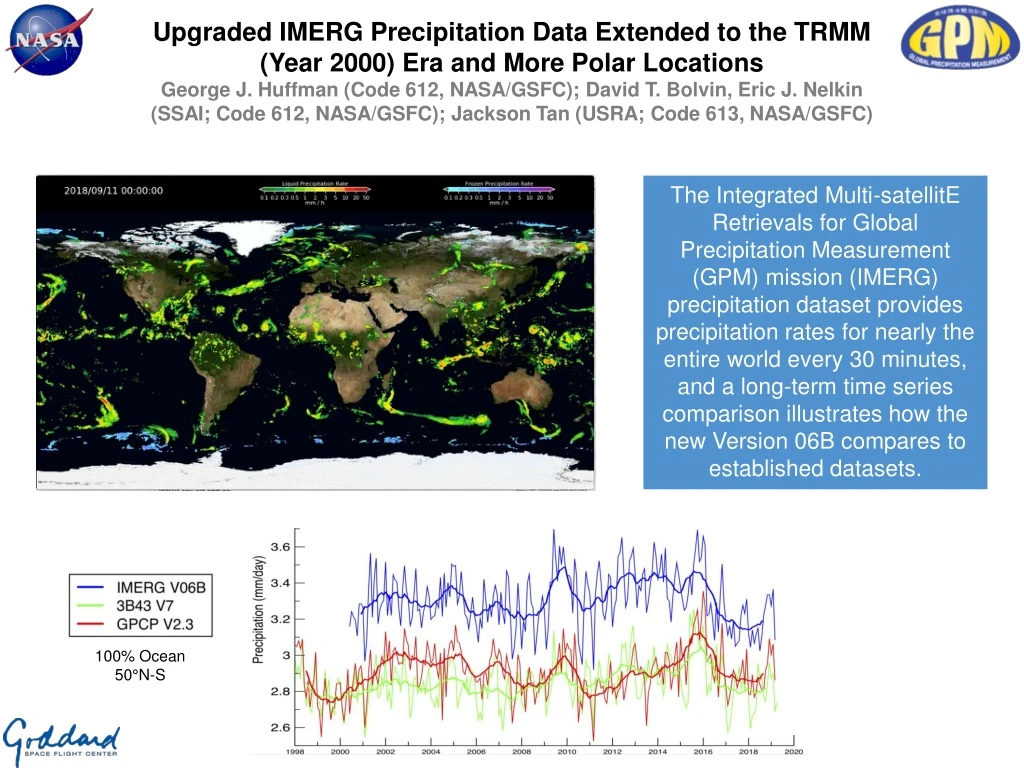
Upgraded IMERG Precipitation Data Extended to the TRMM (Year 2000) Era and More Polar LocationsGeorge J. Huffman (Code 612, NASA/GSFC); David T. Bolvin, Eric J. Nelkin (SSAI; Code 612, NASA/GSFC); Jackson Tan (USRA; Code 613, NASA/GSFC) The Integrated Multi-satellitE Retrievals for Global Precipitation Measurement (GPM) mission (IMERG) precipitation dataset provides precipitation rates for nearly the entire world every 30 minutes, and a long-term time series comparison illustrates how the new Version 06B compares to established datasets. 100% Ocean 50°N-S
Name: George J. Huffman, NASA/GSFC, Code 612 E-mail: george.j.huffman@nasa.gov Phone: 301-614-6308 References: DOI: Early 10.5067/GPM/IMERG/3B-HH-E/06, Late 10.5067/GPM/IMERG/3B-HH-L/06, Final 10.5067/GPM/IMERG/3B-HH/06 Data Sources: The NASA/Japan Aerospace Exploration Agency (JAXA) TRMM and GPM Core Observatory contribute both calibrations of the rest of the constellation (as combined radiometer-radar estimates) and direct microwave precipitation estimates. Passive microwave constellation satellites used during 2000-present include: 1 NASA (JAXA sensor); 1 Centre National d'ÉtudesSpatiales/Indian Space Research Organisation; 7 U.S. Department of Defense; 2 European Organisation for the Exploitation of Meteorological Satellites (EUMETSAT); 1 JAXA; 7 U.S. National Oceanic and Atmospheric Administration (NOAA). As well, IMERG uses IR data from EUMETSAT, JAXA, and NOAA geosynchronous satellites; global surface gauge analyses from the Global Precipitation Climatology Centre; vertically integrated vapor for feature tracking from the NASA Global Modeling and Assimilation Office; and ancillary analysis/forecast data from European Centre for Medium-range Weather Forecasting, JAXA, and NOAA. Processing is carried out by the NASA Precipitation Processing System (PPS). [Note that all NOAA satellites are built by NASA.] A complete listing is provided in the technical documentation at https://pmm.nasa.gov/sites/default/files/document_files/IMERG_doc_190313.pdf. Technical Description of Figures: Upper figure: IMERG provides half-hourly 0.1°x0.1° precipitation estimates that are nearly globally complete, only lacking coverage in polar regions where the surface is snowy/icy. In addition to the calibrated precipitation rate (shown for 00 UTC on 11 September 2018), IMERG contains data fields providing the input datasets, a quality index, and a probability that the precipitation phase is liquid. The last is thresholded at 50% and used to separate the precipitation depiction into rain (bright colors) and snow (blue colors). An animation of the last week of IMERG is available at https://svs.gsfc.nasa.gov/cgi-bin/details.cgi?aid=4285, which is updated every hour. This particular figure was chosen because it displays three tropical cyclones in the tropical Atlantic Ocean and two off the east coast of Asia, in addition to the usual Intertropical Convergence Zone (rainfall near the Equator), subtropical highs (rain-free zones at low latitudes), and mid-latitude storm tracks. Lower figure: The long-term time series for the new Version 06 IMERG Final Run (blue), both as monthly and smoothed time series, is both a key test of its stability and a scientifically interesting product. The current Version 2.3 Global Precipitation Climatology Project Satellite-Gauge (GPCP SG) product (red) and Version 7 TRMM Multi-satellite Precipitation Analysis (TMPA; green) are shown for comparison. The global ocean is chosen for display since all three datasets have a similar surface gauge-dominated performance over land, and the area is limited to the latitudinal extent of the TMPA dataset (50°N-S). Each dataset has a long-term average characteristic of its calibrator, and the higher value for IMERG is considered reasonable based on diagnostics that show the GPCP SG to be 5-8% low. All three datasets show similar interannual peaks and minima, but there are slight, systematic phase shifts that appear to be related to the use or not of satellite radar data in the intercalibration of the various satellites within each product. Scientific significance, societal relevance, and relationships to future missions: IMERG is the most-requested GPM dataset; it integrates the entire GPM constellation and generates a relatively fine-scale, long-term record with three different latencies that addresses a wide range of expert and non-expert uses and societal benefit areas. Examples include flood and landslide analysis, drought analysis, agricultural forecasting, climatological statistics (including extreme precipitation case analyses), micro-insurance, water-related disease tracking, wildfire analysis in boreal forests, global water cycle studies, and numerical model validation. IMERG depends critically on high-quality retrievals from individual sensors, so continued progress on improving these retrievals for “difficult” situations is important, particularly the retrieval of solid precipitation, particularly when the surface is snowy/icy. In turn, improved quality in these retrievals will improve the quality of IMERG products and materially affect the research and societal benefit areas listed. The upcoming Aerosols, Clouds, Convection and Precipitation concept, which is being developed out of the Decadal Survey, should provide key process insights for these retrievals and subsequent improvement of IMERG quality for users. Earth Sciences Division - Atmospheres
Aircraft data helps satellites estimate the radiative effects of wildfire smokeTamásVárnai, Charles Gatebe, Code 613, NASA/GSFC, UMBC/JCET, USRA Smoke reflection into various directions Normalized broadband solar reflectance of smoke plume Back scatter towards sun CAR During the ARCTAS campaign conducted in Western Canada, the Cloud Absorption Radiometer (CAR) instrument, installed in the nose cone of the NASA P-3B aircraft, observed the full angular distribution of reflected sunlight as the aircraft circled above a smoke plume. The data collected from the instrument helps to improve the accuracy of satellite data on the radiative impact of smoke from wildfires.
Name: TamásVárnai, NASA/GSFC, Code 613, and UMBC JCET E-mail: tamas.varnai@nasa.gov Phone: 301-614-6408 References: Várnai, T. (613/UMBC), C. Gatebe (613/USRA), R. Gautam, R. Poudyal, and W. Su, 2019: “Developing an Aircraft-Based Angular Distribution Model of Solar Reflection from Wildfire Smoke to Aid Satellite-Based Radiative Flux Estimation”. Remote Sensing, 11, 1509. doi: 10.3390/rs11131509. Data Sources: This research used airborne data from NASA’s Arctic Research of the Composition of the Troposphere from Aircraft and Satellites (ARCTAS) campaign. The data was collected by the Cloud Absorption Radiometer (CAR), Ames Airborne Tracking Sunphotometer (AATS), and Particle Soot Absorption Photometer (PSAP) instruments. The analysis also used Moderate Resolution Imaging Spectroradiometer (MODIS) Climate Modeling Grid BRDF/Albedo Model Parameters Product (MCD43C1) and Clouds and the Earth’s Radiant Energy System (CERES) angular distribution models. Technical Description of Figures: Graphic 1: Top left: Photo of the CAR instrument installed in the nose cone of the NASA P-3B aircraft for the ARCTAS campaign. Bottom left: A photo of the smoke plume observed by CAR on July 2, 2008 over boreal forests in western Canada. Right: Angular distribution of normalized top-of-atmosphere broadband solar reflection from the smoke plume derived from CAR observations. The numbers along the perimeter indicate relative azimuth angles (with forward and back scattering in the upper and lower halves, respectively, as the sun is at 180° azimuth); the numbers at concentric circles indicate viewing zenith angles (with zenith reflection at the center and near-horizontal reflection close to the edge). The plot was obtained by combining CAR observations with radiative transfer modeling that filled the gaps between CAR’s 10 wavelengths and accounted for the effects of air above the aircraft. Notable features include (a) increased reflectance in forward scattering directions, due to scattering by smoke particles at short wavelengths (b) surface features such as lakes, which appear because the smoke layer is transparent at longer wavelengths, (c) clouds embedded into the smoke layer around 150° azimuth. Scientific significance, societal relevance, and relationships to future missions: This work demonstrates that airborne measurements can bring significant improvements in the accuracy of satellite-based radiative flux estimates. In particular, it is shown that aircraft measuring the full angular distribution of reflected sunlight can help improve smoke albedo estimates for current and planned broadband satellite instruments such as CERES or CLARREO (Climate Absolute Radiance and Refractivity Observatory), even if conditions are fairly different for the satellite and airborne observations. The aircraft data can help, because satellites estimate the total reflection using observations taken from a single view direction—and rely on statistical models to account for the angular variations that have been obtained here for a smoke plume using detailed CAR observations. Overall, the results are expected to help improve satellite-based estimates of the radiative effect of wildfire smoke. This, in turn, can lead to more realistic treatment of wildfire smoke in climate simulations. Given the strong radiative impact of smoke and the observed and foreseen increase in the frequency of wildfires, the results can, ultimately, contribute to improving the accuracy of climate predictions. This research contributes to NASA efforts regarding the "impact of aerosols on global warming”, one of the research priorities identified as “very important” in the recent Decadal Survey. Earth Sciences Division - Atmospheres
Aura/OMI Solar Spectral Irradiances: Comparisons with Independent Datasets and Model Predictions Sergey V. Marchenko 1,2, Thomas N. Woods3, Matthew T. DeLand1,2, Stephen Mauceri3, Peter Pilewski3, Margit Haberreiter4 1SSAI, 2NASA Goddard Space Flight Center, 3Laboratory for Atmospheric and Space Physics, University of Colorado at Boulder, 4Physikalisch-Meteorologisches Observatorium and World Radiation Center, Davos (Earth and Space Sci., 2019, in review) ----------------------------------------------------------------------------------------------------------------------------------------------------------------------------------- Long-term Aura/OMI measurements reveal intrinsic solar variability in unprecedented detail, down to ~0.1% for individual events (the line-of-sight passage of active facular regions or big groups of sunspots).
Name: Sergey Martchenko, SSAI and NASA/GSFC, Code 614 E-mail: sergey.marchenko@ssaihq.com Phone: 301-867-6346 Reference: Marchenko, S.V., Woods, T.N., DeLand, M.T., Mauceri, S., Pilewski, P., Haberreiter, M., Aura/OMI Solar Spectral Irradiances: Comparisons with Independent Datasets and Model Predictions, Earth and Space Sci., in review, 2019. Data Sources: The degradation-corrected, wavelength-binned ~daily OMI solar observations are publicly available at: http://lasp.colorado.edu/lisird Technical Description of Figure: The degradation-corrected and wavelength-binned ~daily OMI solar spectral irradiances follow the gradual changes of solar activity levels during the solar cycle 24. These gradual changes are frequently modulated by passage of large, relatively hot active regions (faculae) that mostly affect the shortwave radiation, producing sharp upward spikes. The hot facular regions are usually accompanied by groups of sunspots that are substantially cooler (darker) than the ambient solar surface. Such sunspot groups, once brought into the line of sight, cause rapid downward flux changes. Scientific significance: Climate studies rely on detailed knowledge of the total energy balance, in particular, on the spectral and temporal changes of solar flux. These changes should be followed with ~weekly (preferably, ~daily) observations spanned over a typical solar cycle (~11 years), preferably multiple cycles. The Aura Ozone Monitoring Instrument is uniquely positioned to deliver the required long-term, stable, ~daily solar data that span the entire solar cycle 24. The improved model of optical degradation of the instrument provides the solar spectral irradiances (SSI) that are broadly used for validation of the solar models, NRLSSI2 in particular. Comparison with the concurrent independent observations and model predictions show good-to-excellent (predominantly, to ∼ 0.1% in UV, and down to ∼ 0.01% in the visible) agreement between the various models and observations, if one to consider the relatively short-term (~months) events related to line-of-sight passage of active solar regions. The long-term (decadal, solar cycle) SSIs pose more challenges, with model-observation and observation-observation disagreements frequently exceeding ∼0.5% in the UV range (especially in the mid-UV domain populated by strong spectral transitions). In the visible, though, the long-term model-observation inter-comparisons show good agreement, down to ∼ 0.05%. Earth Sciences Division - Atmospheres


