Download
1 / 26
270 likes | 512 Vues
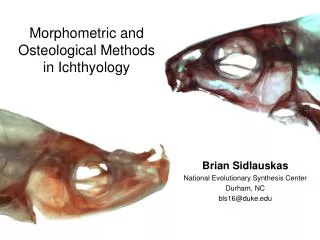
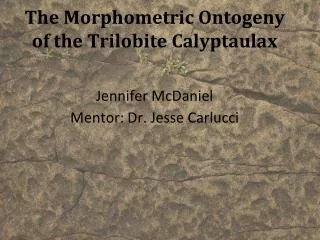
The Morphometric Ontogeny of the Trilobite Calyptaulax. Jennifer McDaniel Mentor: Dr. Jesse Carlucci. The Morphometric Ontogeny of the Trilobite Calyptaulax. Trilobites are extinct arthropod that make up the class Trilobita. They are the most diverse fossil group of the Paleozoic.

E N D
The Morphometric Ontogeny of the Trilobite Calyptaulax Jennifer McDaniel Mentor: Dr. Jesse Carlucci
The Morphometric Ontogeny of the Trilobite Calyptaulax Trilobites are extinct arthropod that make up the class Trilobita. They are the most diverse fossil group of the Paleozoic.
Trilobites could enroll for protection. Armadillidium vulgare
Trilobites provide us with the earliest record of an advanced invertebrate visual system.
In the Cambrian and Lower Ordovician, trilobites are abundant and their remains are often the primary components of limestones Our specimens have been silicified, so that only the limestone is dissolved when exposed to Hydrochloric Acid. CaCO3(s) + 2H+(aq) + [2Cl-(aq)] --> Ca2+(aq) + CO2(g) + H2O(l) + [2Cl-(aq)]
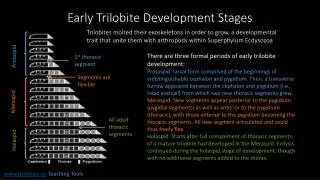
What are trilobites and how do they grow? (Ontogeny) • Protaspid:Disk or globular shape, no true segmentation. • Meraspid:Adds thoracic segments with each molt. • Holaspid:Gets larger with each molt, adult number of thoracic segments.
Hypotheses to be tested • Shape change during the development of the trilobite Calyptaulax is allometric (Adults are not simply scaled up versions of larger ones). • The transition from meraspid to holaspid stage can be seen in the head and trail and is not just dependent on an adult number of thoracic segments.
Landmark Selection • Landmarks are a biological coordinate. • Must provide adequate coverage of the form • Can be found reliably across specimens in different states of preservation. • Consistency of relative position • Coplanarity of landmarks (accounting for orientation)
Type 1 landmarks are the most useful for defining shape they occur at intersections.Type 2 landmarks are at the end of a line or other feature.Type 3 landmarks are the most unreliable and are only used when they can not be avoided and occur on a curved line.
These landmarks, A,B, and C work as a axis of symmetry allowing to use partial samples as we can flip the image over the base. A B C
These landmarks, A,B, and C also act as a baseline to show the direction of shape change vectors. A B C
Type 2 • The next three land marks are at the inside edge of furrows S1, S2 and S3
Type 1 • The next landmarks are where the same sections (S1 S2 and S3) meet the Axial furrow.
Type 1 • Where the occipital and the axial furrows intersect. Where the axial and the palpebral furrow intersect. Where the palpebral and posterior furrow intersect. At the outside most point of the palpebral furrow.
1010.00000 1502.00000 1045.00000 1460.00000 1082.00000 1419.00000 1124.00000 1385.00000 1170.00000 1356.00000 1220.00000 1333.00000 1269.00000 1309.00000 1319.00000 1286.00000 1371.00000 1284.00000 1386.00000 1278.00000 1364.00000 1229.00000 1358.00000 1175.00000 1360.00000 1120.00000 1352.00000 1063.00000 1368.00000 1014.00000 1404.00000 973.00000 1444.00000 935.00000 1486.00000 901.00000 1529.00000 867.00000 1573.00000 835.00000 1621.00000 807.00000 1664.00000 774.00000 1710.00000 745.00000 1757.00000 718.00000 1806.00000 692.00000 1858.00000 668.00000 1903.00000 646.00000 1950.00000 619.00000 2000.00000 596.00000 2048.00000 571.00000 2097.00000 549.00000 2152.00000 548.00000 IMAGE=Cran1 34.6 and 0.75cm standard.tif SCALE=0.003447 Raw Data LM=11 2201.00000 2464.00000 2182.00000 2180.00000 2174.00000 551.00000 1875.00000 1467.00000 1916.00000 1716.00000 1927.00000 1934.00000 1759.00000 2236.00000 1778.00000 2036.00000 1684.00000 1873.00000 1444.00000 1344.00000 1352.00000 1541.00000 CURVES=1 POINTS=50 1259.00000 2266.00000 1212.00000 2238.00000 1163.00000 2214.00000 1113.00000 2191.00000 1063.00000 2169.00000 1016.00000 2142.00000 978.00000 2103.00000 947.00000 2058.00000 915.00000 2013.00000 895.00000 1964.00000 889.00000 1910.00000 882.00000 1856.00000 889.00000 1801.00000 896.00000 1747.00000 908.00000 1694.00000 928.00000 1643.00000 950.00000 1593.00000 Landmarks x/y coordinates Semi-landmark coordinates alonga curve. Scaling Factor
Centroid Size Centroid size is the square root of the sum of squared distances of a set of landmarks from thier centroid. The centroid is determined by the average of the x,y coordinates.
Future Work • We are still collecting data, when we are done we need to apply multivariate statistics to the data.
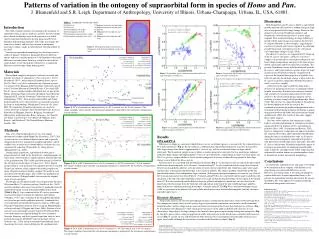
Future Work (Procrustes Superimposition) These are trilobite landmark coordinates after they have been superimposed: rotated, scaled by centroid size, and moved so that only shape differences remain. The denominator of the formula for the Procrustes distance between two sets of landmark configurations is the product of their Centroid Sizes. Kim et al. 2002
Testing the hypothesis of merapsid-holaspid shape change • Procustes Distance = shortest distance along an arc between two landmarks Holaspid Meraspid Kim et al. 2002
PCA • Principle Components Analysis to find out which aspects of shape change explain the most variance as the trilobite grows.
Thin Plate Spline analysis to show how coordinates deform during different portions of ontogeny and the movement of which coordinates best explains the shape differences. Webster et al. 2011