Download
1 / 34
340 likes | 355 Vues
Discover insights from a survey conducted among adults who participated in Legacy Foundation's On the Table conversations, exploring community views, priorities, and ways to effect change. Participants hold a positive outlook on community unity and progress, advocating for addressing issues like jobs/economic development, crime, and education. They identify nonprofits, community residents, and local government as key partners for community progress. The survey reveals a shared optimism for making a positive impact within their communities.

E N D
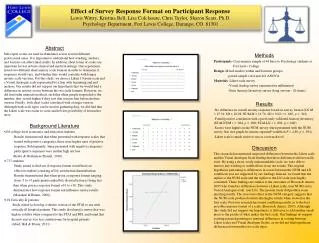
On the Table 2018 Participant Perspectives on Community and How to Effect Change Key findings from a survey among adults who participated in Legacy Foundation On the Table conversations, with support from The John S. and James L. Knight Foundation, September 2018
Methodology • Online and paper survey • 1,212 adults who participated in Legacy Foundation On the Tableconversations September 26, 2018 • Survey field period: September 26 to October 10, 2018 • Notes: • For each question, percentages are based on the total number of respondents who answered it. • “Whites” self-identify as non-Hispanic white adults. • “African Americans” self-identify as non-Hispanic African-American or black adults. • Geographic regions are defined by ZIP Codes. Northwest: 46312 46320 46321 46322 46323 46324 Northeast: 46402 46403 46404 46405 46406 46407 Central: 46319 46342 46375 46408 46409 46410 South: 46303 46307 46356 46373 Legacy Foundation estimates that 2,135 adults participated in On the Table conversations in 2018.
Profile of On The Table Survey Respondents GENDER Men Women Other not listed HISPANIC/LATINOBACKGROUND RACE 18 to 34 65/older 25%Parent of minor child AGE 50 to 64 35 to 49 Hispanic/Latino Non-Hisp/Latino Whites African Americans Asians Others Biracial/multiracial
Profile of On The Table Survey Respondents (cont’d) Geographic Areas PARTY IDENTIFICATION 24% 53% 2% 12% 41% VOTE in every local election 21% PARTICIPATED in OTT last year
Key Takeaways • On the Table participants who completed the survey have a broadly positive outlook about their community and feel hopeful about the future. • While they are twice as likely to feel that their community is more united than divided, they are evenly split on whether their community provides opportunities for all; African Americans, Millennials (age 18 to 34), and those in the Northeast feel this inequity more than others. • Attendees identify nonprofits, community residents, and local government as the most impactful partners for community progress. • Jobs/economic development and crime are the top issues that attendees would like to see addressed in their community, and these are the top issue priorities regardless of race/ethnicity or where in the community they live. Education issues (local schools and early childhood) are second-tier priorities.
Key Takeaways (cont’d) • When it comes to specific priorities for addressing issues identified in Legacy Foundation’s 2017 On the Table conversations, participants provide some guidance on what they feel are the most important aspects to address: • When it comes to education and youth development, attendees place the highest priority on having high-quality schools and qualified teachers, but they see all of the potential areas of action as priorities to some degree. Many feel that job/vocational training, college preparation, before- and after-school programs, and affordable child care/preschool should be priorities. • When it comes to economic issues and poverty, they place the highest priority on the availability of good-paying jobs and addressing the lack of training and workforce skills. Millennials also prioritize addressing drug use and addiction. • When they think about ways to address equality within their community, attendees focus first on addressing the lack of access to core services depending on where you live. Addressing racism is also a high priority, particularly for African Americans and Hispanics. • Attendees’ top transportation priorities are road improvements and access to bus service.
Key Takeaways (cont’d) • Attendees are optimistic that they can effect positive change in their community themselves, and they identify a variety of ways they would be interested in getting involved. They are most interested in participating in a volunteer service event and joining a small group that regularly meets to discuss issues. • The best way for Legacy Foundation to communicate with them about opportunities for community engagement varies by age: those under age 50 say the best way to inform them of opportunities to get involved is through social media, while older attendees tend to prefer e-mails above other means. • More than half of participants say their On the Table conversation led them to connect with new people, learn more about their community, and understand how to take action. • Nearly nine in 10 attendees surveyed say they will return next year.
On the Table participants are overwhelmingly hopeful about what the future holds for their community. Looking ahead to the next five years or so, do you feel more hopeful or more worried about what the future holds for your community?
Large majorities view their community positively on key dimensions, but they are divided about opportunities for everyone. The area where I live has a strong sense of community My community is changing for the better Residents have shared goals/priorities for our community My community provides opportunities for everyone 71% 67% 62% Some-what 51% 49% 38% 33% 29% Strongly
African-American and younger participants are among the most likely to say their community does NOT provide opportunities for all. My community provides opportunities for everyone:
Participants who live in the Northeast are among the most likely to say their community does NOT provide opportunities for all. My community provides opportunities for everyone:
Two in three attendees believe their community is more united than divided, but those in the Northwest and Northeast are less likely to feel this way. Do you think people in your community are more united or more divided when it comes to addressing important goals and challenges? My community is more UNITED: Much more Somewhat more My community is more DIVIDED: Much more Somewhat more 71% 69% 66% 59% 58% 42% 41% 34% 31% 29% All attendees Northwest Northeast Central South
Majorities see their community as united, but whites are more likely to hold this view than Hispanics and African Americans are. Do you think people in your community are more united or more divided when it comes to addressing important goals and challenges? My community is more UNITED: Much more Somewhat more My community is more DIVIDED: Much more Somewhat more 69% 66% 62% 60% 40% 38% 34% 31% All attendees Whites African Americans Hispanics
Jobs/economic development and crime/public safety are participants’ top priorities for their community to address. THREE most important issues for my community to address: Cited by less than 10%: Social justice 6% Treatment of immigrants 3%in our community
Jobs/economic development and crime/public safety are the most pressing issues across race and ethnicity. THREE most important issues for my community to address:
Priorities vary somewhat by region, but jobs/economic development is important across the board. THREE most important issues for my community to address:
A Deeper Dive on Priorities Identified at 2017 On the Table Conversations During the 2017 OTT conversations, participants identified four priority areas they would like their community to address. 2018 OTT participants who completed the survey were asked to prioritize goals within each of these areas (results on following slides): • Education and Youth Development • Economic Issues and Poverty • Equality • Transportation
Education and Youth Development: high-quality schools and teachers rank as participants’ top priority across the region, other top priorities vary by community. TWO most important issues related to education and youth development for my community to address:
Economic Issues and Poverty: good-paying jobs and training are participants’ top priorities; drugs and addiction is also a top priority among Millennials. TWO most important issues related to economic issues and poverty for my community to address:
Equality: Lack of access to core services is the top priority across race, though racism is a higher priority among African Americans and Hispanics than whites. TWO most important issues related to equality within our community for my community to address:
Transportation: Across the region, road repairs, and access to bus service are participants’ top priorities. TWO most important issues related to transportation for my community to address:
Nonprofits, residents, and local government are recognized as the greatest agents of change. TWO or THREE groups that have the greatest impact on making my community a better place to live:
Significant majorities are involved and believe they can make their community a better place to live. Involvement in my community and neighborhood activities: Impact people like me can have in making my community a better place: 86% Very involved: Age 18 to 34 65% Age 35 to 49 79% Age 50 to 64 74% Age 65/older 74% Whites 75% Afr Americans 75% Hispanics 61% Big impact: Age 18 to 34 88% Age 35 to 49 89% Age 50 to 64 87% Age 65/older 76% Whites 86% Afr Americans 88% Hispanics 85% 73% Big impact Very involved
There are a variety of ways participants would get involved; service events and small group discussions are most likely. In which THREE of these ways that people can get involved in addressing issues and challenges facing their community would you be most interested in getting involved?
There are some differences by age and community in preferred ways to get involved.
The best ways to communicate about engagement opportunities vary by age. Which of these are the best ways for Legacy Foundation to inform you about opportunities to get involved in addressing issues and challenges facing your community?
The top barriers to getting more involved are time and uncertainty about how to get involved or be helpful. Which of these prevent you from getting more involved in issues affecting your community?
OTT conversations led to connections and better understanding of issues and how to address them. Which of these apply to you related to your On the Table experience? I spoke with at least one person that I did not already know I learned about important issues in my community The conversation helped me better understand how I can take action to help address issues and challenges in my community I exchanged contact information with at least one person that I did not already know
Nine in 10 plan to take specific actions regarding something they discussed during their OTT conversation. How likely are you to take specific actions or next steps regarding an issue or solution discussed at your On the Table conversation? 88% 93% say they are very or somewhat likely to take part in an On the Table conversation next year. Very likely
Actions participants will take as a result of On the Tableconversation What specific actions do you plan to take as a result of your conversation?