Download

1 / 31
320 likes | 659 Vues
CAPITAL BUDGETING (REVIEW). Revenue and Cost Estimates. Example Linksys has completed a $300,000 feasibility study to assess the attractiveness of a new product, HomeNet . The project has an estimated life of four years. Revenue Estimates Sales = 100,000 units/year Per Unit Price = $260.

E N D
Revenue and Cost Estimates • Example • Linksys has completed a $300,000 feasibility study to assess the attractiveness of a new product, HomeNet. The project has an estimated life of four years. • Revenue Estimates • Sales = 100,000 units/year • Per Unit Price = $260
Revenue and Cost Estimates • Example • Cost Estimates • Up-Front R&D = $15,000,000 • Up-Front New Equipment = $7,500,000 • Expected life of the new equipment is 5 years • Housed in existing lab • Annual Overhead = $2,800,000 • Per Unit Cost = $110
Incremental Earnings Forecast HomeNet’sIncremental Earnings Forecast 11,000260 11,000110 new equipment
Capital Expenditures and Depreciation • The $7.5 million in new equipment is a cash expense, but it is not directly listed as an expense when calculating earnings. Instead, the firm deducts a fraction of the cost of these items each year as depreciation. • Straight Line Depreciation • The asset’s cost is divided equally over its life. Annual Depreciation = $7.5 million ÷ 5 years = $1.5 million/year
Interest Expense • In capital budgeting decisions, interest expense is typically not included. The rationale is that the project should be judged on its own, not on how it will be financed.
Taxes • Marginal Corporate Tax Rate • The tax rate on the marginal or incremental dollar of pre-tax income. Note: A negative tax is equal to a tax credit.
Taxes • Unlevered Net Income Calculation
Indirect Effects on Incremental Earnings • Opportunity Cost • The value a resource could have provided in its best alternative use • In the HomeNet project example, space will be required for the investment. Even though the equipment will be housed in an existing lab, the opportunity cost of not using the space in an alternative way (e.g., renting it out) must be considered.
EXAMPLE • Suppose Pepsi’s new energy drink line will be housed in a factory that the company could have otherwise rented out for $900 million per year. • Pepsi pays a 39% tax rate on its pre-tax income. • How would this opportunity cost affect Pepsi’s incremental earnings next year?
EXAMPLE • Solution • The opportunity cost of the factory is the forgone rent. • The opportunity cost would reduce Pepsi’s incremental earnings next year by: • $900 million × (1 − .39) = $549 million.
Indirect Effects on Incremental Earnings • Project Externalities • Indirect effects of the project that may affect the profits of other business activities of the firm. Cannibalization is when sales of a new product displaces sales of an existing product.
Indirect Effects on Incremental Earnings • Project Externalities • In the HomeNet project example, 25% of sales come from customers who would have purchased an existing Linksys wireless router if HomeNet were not available. Because this reduction in sales of the existing wireless router is a consequence of the decision to develop HomeNet, we must include it when calculating HomeNet’s incremental earnings.
Indirect Effects on Incremental Earnings HomeNet’sIncremental Earnings Forecast Including Cannibalization and Lost Rent
Sunk Costs and Incremental Earnings • Sunkcosts are costs that have been or will be paid regardless of the decision whether or not the investment is undertaken. • Sunk costs should not be included in the incremental earnings analysis.
Sunk Costs and Incremental Earnings • Past Research and Development Expenditures • Money that has already been spent on R&D is a sunk cost and therefore irrelevant. The decision to continue or abandon a project should be based only on the incremental costs and benefits of the product going forward.
Real-World Complexities • Typically, • sales will change from year to year. • the average selling price will vary over time. • the average cost per unit will change over time.
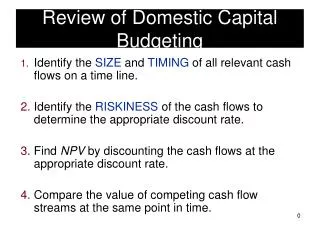
Determining Free Cash Flow and NPV • The incremental effect of a project on a firm’s available cash is its free cash flow.
Calculating the Free Cash Flow from Earnings • Capital Expenditures and Depreciation • Capital Expenditures are the actual cash outflows when an asset is purchased. These cash outflows are included in calculating free cash flow. • Depreciation is a non-cash expense. The free cash flow estimate is adjusted for this non-cash expense.
Calculating the Free Cash Flow from Earnings • Capital Expenditures and Depreciation Calculation of HomeNet’s Free Cash Flow (Including Cannibalization and Lost Rent)
Calculating the Free Cash Flow from Earnings • Net Working Capital (NWC) • Most projects will require an investment in net working capital. • Trade credit is the difference between receivables and payables. • The increase in net working capital is defined as:
Calculating the Free Cash Flow from Earnings HomeNet’sNet Working Capital Requirements
Calculating Free Cash Flow Directly • Free Cash Flow • The term tc× Depreciation is called the depreciation tax shield.
Calculating the NPV • HomeNet NPV (WACC = 12%) Computing HomeNet’s NPV
Choosing Among Alternatives • Launching the HomeNet project produces a positive NPV, while not launching the project produces a 0 NPV. • Evaluating Manufacturing Alternatives
Further Adjustments to Free Cash Flow • Terminal or Continuation Value • This amount represents the market value of the free cash flow from the project at all future dates.
Analyzing the Project • Break-Even Analysis • The break-even level of an input is the level that causes the NPV of the investment to equal zero. • HomeNet IRR Calculation HomeNetIRR Calculation
Sensitivity Analysis • Sensitivity Analysis shows how the NPV varies with a change in one of the assumptions, holding the other assumptions constant.
Sensitivity Analysis Best- and Worst-Case Parameter Assumptions for HomeNet
HomeNet’sNPV Under Best- and Worst-Case Parameter Assumptions