Transient Simulation of Near Past with Interactive Climate Models
10 likes | 102 Vues
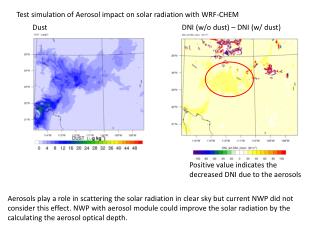
Learn how MAECHAM4/CHEM model replicates ozone, temperature trends over 40 years. Explore impact of solar cycles, volcanoes on ozone, water vapor. Enhance your understanding of stratosphere-troposphere interactions.

Transient Simulation of Near Past with Interactive Climate Models
E N D
Presentation Transcript
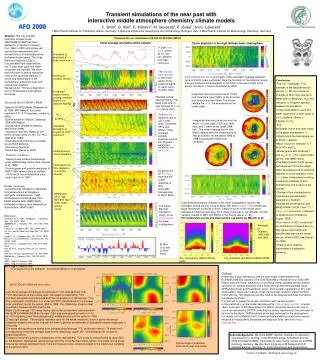
Transient simulations of the near past with interactive middle atmosphere chemistry climate modelsC.Brühl1, B. Steil1, E. Manzini2, M. Giorgetta3, P. Jöckel1, and J. Lelieveld11 Max Planck Institute for Chemistry, Mainz, Germany; 2 National Institute for Geophysics and Volcanology, Bologna, Italy; 3 Max Planck Institute for Meteorology, Hamburg, Germany Abstract: The fully coupled chemistry climate model MAECHAM4/CHEM has been applied for a transient simulation from 1960 to 2000 using observed sea surface temperatures and concentrations of chemically active and greenhouse gases. The Quasi Biannual Oscillation (QBO) is assimilated from observations, the 11 year solar cycle and major volcanoes are included. We show that the model is able to reproduce most of the observed features of ozone and temperature in the stratosphere, including trends and interannual variability. We also show 14CO as a diagnostic tool for stratospheric tropospheric exchange. Transient 40 year simulation with MA-ECHAM4-CHEM Zonal average anomalies at the equator Ozone depletion in the high latitude lower stratosphere 11 year solar cycle, shown as 10.7cm flux variation, and major volcanoes. Increased Ly photolysis at solar maximum The 'tropical tape recorder' or the propa-gation of the seasonal signal in water vapor, monthly mean Heating by volcanic aerosol Total stratospheric ozone anomalies, 10day averages, average seasonal cycle of first 20 years subtracted. Note the formation of the Antarctic ozone hole and variable ozone depletion in the Arctic in the second half of the period. Variations in tropics dominated by QBO. Conclusions • The QBO modulates T via changes in the residual vertical velocity (+/-5K) and ozone via changes in NOx (sign change at 29km due to chemistry!), H2O and transport (+/-0.5ppmv typically between 20 and 35km). • Lower stratospheric ozone and water vapor show a clear signal of ElNino/LaNina (70hPa, +/-0.3ppmv for O3). • The 11 year solar cycle modulates ozone and water vapor in the upper stratosphere (+/-0.2ppmv)and the mesosphere (up to about +/-2ppmv). • Major volcanoes reflected in T, H2O, NOx and O3 • Model agrees with observed T and O3trends (-7K in upper strato-sphere, see WMO, 2003). • The MAECHAM4/CHEM system with observed SST and nudged QBO reproduces a lot of observed features of ozone depletion in the polar lower stratosphere including interannual variability in both hemispheres and position of the vortices. • Transport from stratosphere to troposphere overestimated especially in Southern Hemisphere winter/spring with MAECHAM4/-CHEM (from 14CO diagnostics and ozone, compared to observations compiled by Logan, 1999). • Assimilation of QBO is essential for distributions of tracers like CH4, they agree much better with satellite data than for the model version without QBO (see Steil et al, 2003). • There is still a need for improvement of advection schemes. Enhanced ascent means cooling, reduced ascent or a descent heating Integrated chemical ozone loss at 70hPa over Antarctica (year 1998), using an active and a passive ozone tracer. The arrows indicate the wind, the windmaximum the vortex edge. Residual vertical velocity [mm/s]. The black lines refer to sign changes of zonal wind due to QBO. 48 km 16 The model MA-ECHAM4-CHEM -Spectral GCM ECHAM4 (Roeckner et al, 1996, MPI Report), horizontal resolution T31 (3.75 degrees), surface to 80km. -Spitfire advection (Rasch, Lawrence, 1998, MPI Report) -Gravity wave scheme by Manzini, McFarlane (1998). -Interactive chemistry based on the family concept using Ox, Nx, Clx, HOx (Steil et al, 1998). -Heterogeneous chemistry on sulfate, ice and NAT particles. -Interactive photolysis -Details see Steil et al, 2003. -5 -2 -1 -.5 -.2 -.1 0 .1 .2 .5 1 2 5 CO2 Temperature variations due to QBO, solar cycle, volcanoes, CFCs and GHGs, 10day averages, average seasonal cycle of first 20 years subtracted. La Nina Integrated chemical ozone loss over the Arctic in 2 cold (years 1995 and 1996, right) and 1 warm winter (year 1998, left). The vortex average loss in late March agrees well with observations by Rex et al (2004) for the period 1992 to 1998, including the interannual variability. Increased photolysis of oxygen at solar maximum As above, but for ozone. Homogeneous ozone depletion Boundary conditions -Seasonal sea surface temperatures using GISS/Hadley Center data (Rayner et al, 1996) -Source gases and greenhouse gases of WMO 1999 (mixing ratios at surface). -UV-fluxes at top modulated by solar cycle (Lean et al. 1997 ) Heterogeneous NOx depletion on volcanic aerosol As above, but for NO+NO2. Note that the ozone response to NOx anomalies changes sign at about 29km. Further constraints -Quasi-Biennial Oscillation assimilated from observations at Singapore (Giorgetta and Bengtsson, 1999) -Stratospheric sulfate aerosol from SAGE satellite data (WMO 2003), estimated for Agung from temperature observations (WMO 1986) Westphase QBO, high NOx and high lower strato-spheric ozone Calculated temperature changes in the lower stratosphere using 10 day averages, strong cooling by up to about 30K due to ozone hole in Antarctica, large interannual variability in Arctic. Seasonal cycle of the first 20 years subtracted. Note the heating by the 3 major volcanoes in low latitudes and the variation related to QBO and ElNino in the tropics (about +/- 4K). For temperature trends and observations see poster by Manzini et al! The Quasi-Biennial Oscillation (QBO) of the zonal wind in the lower stratosphere References Giorgetta, M. A., and L. Bengtsson, J. Geophys. Res., 104, 6003, 1999. Jöckel et al., J. Geophys. Res., 107, D20, 4446, 2002. Lean et al. J.Geophys.Res. 102, 29939, 1997. Lin, S.J., and R. Rood, Mon.Wea.Rev. 124, 2046, 1996 Logan, J.,A., J.Geophys.Res. 104, 16151, 1999. Manzini, E. and McFarlane, J.Geophys.Res. 103, 31523, 1998. Manzini et al., J.Geophys.Res., 108, D14, 4429, 2003. Rex, M. et al., Geophys.Res.Lett.. 31, L04116, 2004. Steil et al, Annales Geophysicae, 16, 205, 1998. Steil et al., J. Geophys. Res., 108, D9, 4290, 2003. WMO, Rep. 16, Geneva, 1986. WMO, Rep. 44, Geneva, 1999. WMO, Rep. 47, Geneva, 2003. Averages for Octobers 1993,1994 and 1995 El Nino (red) and La Nina (blue) CH4 observed by UARS/HALOE, ppmv. CH4 simulated with MA-ECHAM4/CHEM. 14CO diagnostics for transport from stratosphere to troposphere Outlook Preliminary 3 year simulations with the new model in development MA-ECHAM5.2/MESSy, based on the GCM ECHAM5.2 (Roeckner et al, 2003, MPI Report 239) with tracer advection Lin and Rood (1996, standard version without correction for surface pressure) and a more general chemistry package using KPP-preprocessor and Rosenbrock-solver, show a better agreement of CH4 with observations; there are, however, other shortcomings related to tracer transport found with the 14CO diagnosis tool that have to be analysed and fixed first before results can be shown. It is planned to repeat the 40 year simulation with the new system. In the preliminary run the model reproduces the 'tropical tape recorder' of water vapor quite well. In the mesosphere it is able to reproduce the diurnal cycle of ozone as observed by CRISTA, including the tertiary maximum at the terminator, in contrast to the faster CHEM-scheme which was optimized for the stratosphere. For details on the Modular Earth Submodel System which contains also several modules for tropospheric processes and diagnosis tools see www.messy-interface.org. MA-ECHAM4-CHEM and observations Left: Zonal average climatology of cosmogenic 14CO compiled from total 14CO observations at the surface level: The biogenic (secondary) 14CO has been estimated and subtracted from the observations of atmospheric 14CO. The cosmogenic contribution is in molec/cm3 STP, standardized to the average solar conditions during the period 1955 to 1988. The climatology shows a clear asymmetry between the NH and the SH. Right: Zonal average 14CO mass mixing ratio at the surface level calculated with the GCM ECHAM4-CHEM for the year 1994, and corresponding fraction (in %) of 14CO originating from the stratosphere (2 middle panels) and the same for 1995 (2 very right panels). The analysis has been done for the whole timeseries, there is some interannual variability related to the vortex strength but there is general overestimate of downward transport especially in SH spring. The mass mixing ratios are scaled to an average global average 14CO production rate of 1.76 molec/cm2s, corresponding to the time average used for the climatology (upper left). Climatological OH is used for separating effects. Transport from stratosphere to troposphere of the stratospheric 14CO-tracer is overestimated by about 60% in the Southern Hemisphere (winter/spring) and 35% in the Northern Hemi-sphere. This holds for the whole time-series without significant trend, there are however some variations related to the interannual variability of the polar vortices. Acknowledgements: We thank BMBF (German ministery for education and research) for funding in the AFO2000 project KODYACS and the DEKLIM project KLIMEX. Computations were mostly carried out at DKRZ, Hamburg, Germany. We also thank the group of M.Dameris at DLR Oberpfaffenhofen, Germany for fruitful discussions and cooperations. Typical range of examples from the 40 year time series Contact: Ch.Brühl, chb@mpch-mainz.mpg.de