Download
1 / 18
180 likes | 294 Vues
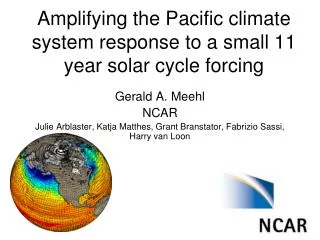
11-year Solar Signal in Transient Climate Simulations. Lesley Gray NCAS University of Oxford. Oxford: Dann Mitchell, Scott Osprey Met Office: Neal Butchart, Steve Hardiman, Sarah Ineson, Adam Scaife Reading: Manoj Joshi Imperial: Indrani Roy.

E N D
11-year Solar Signal in Transient Climate Simulations Lesley Gray NCAS University of Oxford • Oxford: Dann Mitchell, Scott Osprey • Met Office: Neal Butchart, Steve Hardiman, • Sarah Ineson, Adam Scaife • Reading: Manoj Joshi • Imperial: Indrani Roy
Analysis of very long time-varying climate runs (CMIP5) • 1. Brief description of observations of Solar Influence on Climate. • 2. Summary of 3 prime mechanisms for solar irradiance influence (‘top-down / bottom-up’ influences). • 3. Model analysis • Questions • How well do we model solar influence on climate? - focus on Atlantic / European response • Can we use models to improve understanding of mechanisms, given that we have limited observational time records?
Observations Smax minus Smin Temperature Ozone Regression analysis of ERA data Annual average 1979-2008 Frame and Gray 2010 Gray, Rumbold and Shine 2009 Regression analysis of SAGE satellite dataset Annual average 1985-2003 Soukharev and Hood 2006 Solar Maximum: More UV radiation => higher temps More ozone => higher temps (early work of Labitzke; Haigh)
Observations: Zonal winds Smax minus Smin Stratosphere Troposphere winds Climatology (m/s) Smax minus Smin (m/s) temps NCEP zonal winds/temps 1979-1999 NCEP DJF zonally-averaged zonal winds 1979-2002 Haigh,Blackburn,Simpson,Sparrow +ve NAO Pattern at surface Kuroda and Kodera 2002
Observations: Mean Sea Level Pressure (max-min) (min-max) HadSLP2 1956-2004 ERA-40 1958-2001 Woollings et al 2010 See also Ineson et al 2011 1856-1905 Response is REGIONAL Solar max minus min can reach ~5-8 hPa in Atlantic but amplitude / sign varies with time => scepticism ... Roy and Haigh 2010
Observations: Surface temperatures Meehl et al. 2009 White and Liu 2008 Response is REGIONAL and very small ~tenths K globally No agreement on spatial pattern; depends on how solar max/min are defined (Roy and Haigh 2010) Zhou and Tung 2010) • NOAA Extended Reconstructed SST • Hadley Centre HadISST • 1871-present
Mechanisms: top-down Smax minus Smin temperature Solar Maximum: More UV radiation => higher temps More ozone => higher temps 2 ‘top-down’ routes: Polar route: planetary waves / SSWs (only during winter) Equatorial route: synoptic-scale waves (all year round) POLAR ROUTE +ve temp anomaly at stratopause westerly subtropical wind anomaly altered planetary wave propagation = > fewer sudden stratospheric warmings (SSWs) +ve temp anomaly lower strat => increased horizontal temp grad. => altered synoptic wave propagation EQUATORIAL ROUTE +ve NAO at surface in Smax
Mechanisms: bottom-up The ‘bottom-up’ mechanism through total solar irradiance (TSI): Increased solar absorption during Smax in cloud-free subtropical oceans, increases evaporation; increased moisture converges into precipitation zones, intensifies precipitation and upward vertical motions, which strengthens Hadley and Walker circulations; stronger subsidence in subtropics gives positive feedback that reduces clouds and allows increased solar forcing. Cubasch, van Loon, Meehl, White
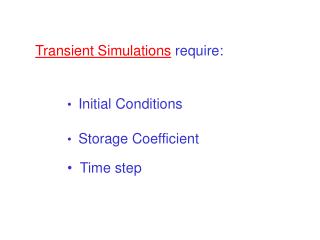
The MODEL Coupled ocean-troposphere-stratosphere Unified model (HadGEM2-CC) • Stratosphere resolving coupled ocean-atmosphere • Atmosphere: N96 1.875° x 1.25° 60 levels 0-84km (high-top) • Ocean: 1.0° x 0.83° 40 levels • includes non-orographic GWD scheme; interactive carbon cycle but no tropospheric or stratospheric interactive chemistry Historical+future ‘all-forcings’ CMIP5 simulations: • 1x ensemble 1860-2100 • 2x ensembles 1960-2100 Increasing greenhouse gases (RCP8.5); monthly ozone variations are imposed, including ozone hole development + recovery; aerosols, solar cycle. 520 years
Solar Irradiance Variations Lean et al. up to 2005; idealised in future (average of last 4 cycles) Spectrally partitioned based on traditional view i.e. NOT using recent SIM UV observations Corresponding variations also imposed in ozone fields 520 years = 47x 11-yr cycles
Multiple Linear Regression Analysis with autoregressive noise model (AR1) 8 regression indices: CO2, ozone, 11-year solar cycle, long-term solar trend, volcanic aerosol, ENSO 3.4 index, 2 x QBO indices
Model Results: Smax minus Smin 95% significance 95%+99% significance Temperature Stratospheric winds 90%+95% significance Tropospheric winds
Model Results: Mean sea level pressure Smax minus Smin DJF MAM JJA SON 520 years 47 solar cycles 95+99% confidence
Model – Obs Comparison: DJF Smax minus Smin in MSLP Model 45-year period ‘X’ 520-year period Observations 1956-2004 1856-1905
DJF What’s going on during ‘rogue’ 45-periods? All years Model Zonal winds SON DJF 45-year period ‘X’ 80%+95% confidence Possible non-linear interactions with QBO? ENSO?
Model Results:Surface Temperatures Smax minus Smin SON DJF 95%+99% confidence 520 years 47 solar cycles
Summary • Model appears to capture both top-down mechanisms and bottom-up mechanism • Model has periods where solar signal in troposphere appears to reverse – similar to obs BUT overall there IS an 11-year signal in mslp (primarily NAO region) and in SSTs (Europe and tropics) • Still much to be understood in terms of mechanisms especially the relative timing / lagged responses and how solar interacts with QBO and ENSO.
Additional model runs – Amanda Maycock 3 x ensembles 2005-2070