Download
1 / 44
440 likes | 640 Vues
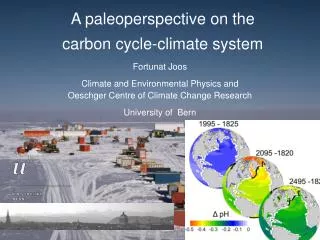
Amplifying the Pacific climate system response to a small 11 year solar cycle forcing. Gerald A. Meehl NCAR Julie Arblaster, Katja Matthes, Grant Branstator, Fabrizio Sassi, Harry van Loon. There is a lot of evidence correlating solar forcing with climate:

E N D
Amplifying the Pacific climate system response to a small 11 year solar cycle forcing Gerald A. Meehl NCAR Julie Arblaster, Katja Matthes, Grant Branstator, Fabrizio Sassi, Harry van Loon
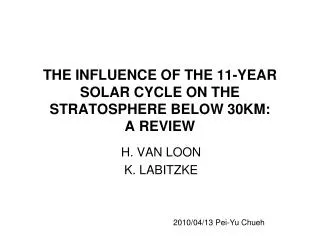
There is a lot of evidence correlating solar forcing with climate: In the stratosphere (e.g. van Loon and Labitzke, 2000, and many more) In the troposphere (van Loon and Labitzke, 1993, 1994, 1998; van Loon and Shea, 1999,2000; Christoforou and Hameed, 1997; Gleisner and Theijll, 2003; etc.) In the ocean (White et al., 1997, 1998; Bond et al., 2001; etc.) Paleoclimate (Mann et al., 2005; etc.)
The 11 year solar cycle has been shown to have an association with low amplitude La Niña-like sea surface temperature (SST) anomalies in the tropical Pacific van Loon, H., G. A. Meehl, and D. J. Shea, 2007, Journal of Geophysical Research Meehl, Arblaster and Branstator, 2008, J. Climate van Loon, H., and G.A. Meehl, 2008: J. Atmospheric. and Solar-Terrestrial Physics
The most well-documented mechanism proposed to explain the climate system response to solar forcing: “top-down” stratospheric ozone mechanism
The top-down stratospheric ozone mechanism Increased solar increased ozone heating/increased ozone amount modified temperature and zonal wind altered wave propagation changed equator to pole energy transport and circulation enhanced tropical precipitation (e.g. Haigh, 1996; Shindell et al., 1999; Balachandran et al., 1999; Kodera and Kuroda, 2002)
Changes in UV (to approximate combined effects of UV and stratospheric ozone changes associated with solar variability) in GISS model with resolved stratosphere and fixed SSTs shows enhanced Intertropical Convergence Zone (ITCZ) and South Pacific Convergence Zone (SPCZ) vertical motion and precipitation with peaks in solar forcing (Balachandran et al., 1999) Enhanced vertical motion in solar peaks Enhanced ITCZ and SPCZ precip
For increased solar input during the first half of the 20th century, climate model simulations indicate enhanced ITCZ and SPCZ precipitation and a La Niña-like (or cold event-like) response (Meehl, G.A., W.M. Washington, T.M.L. Wigley, J.M. Arblaster, and A. Dai, 2003: J. Climate, 16, 426--444.)
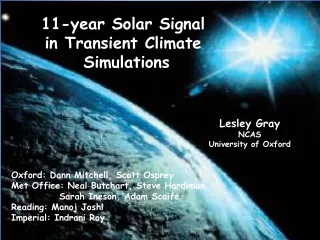
Two global coupled climate models show a similar La Niña-like response to peaks in the 11 year solar cycle in multi-member ensembles 11 peak solar years, 4 member ensemble for PCM, 5 member ensemble for CCSM3 (Meehl, G.A., J.M. Arblaster, G. Branstator, and H. Van Loon, 2008: J. Climate)
Is this a solar-forced response or could it occur due to inherent decadal El Niño variability? Joint MTM-SVD spectra, CCSM3, Nino3.4 significant peak around 11 years for 20th century run with solar forcing (bottom), but not in long term control run (top); thus the SST response in the tropical Pacific is solar-forced in the model
A new mechanism proposed to explain this response to solar forcing: “bottom-up” coupled air-sea mechanism
The bottom-up coupled air-sea mechanism: increased solar over cloud-free regions of the subtropics translates into greater evaporation, and moisture convergence and precipitation in the ITCZ and SPCZ (and south Asian monsoon), stronger trades, and cooler SSTs in eastern equatorial Pacific Meehl, G.A., W.M. Washington, T.M.L. Wigley, J.M. Arblaster, and A. Dai, 2003, J. Climate Van Loon, Meehl and Arblaster, 2004, JASTP Meehl, G.A., J.M. Arblaster, G. Branstator, and H. Van Loon, 2008, J. Climate
Teleconnections over the North Pacific and North America depend on the size and location of the tropical Pacific precipitation and convective heating anomalies (Meehl, Arblaster, Branstator, and van Loon, J. Clim. 2008)
Could the two mechanisms add together to boost the climate response to solar forcing? • “top-down” stratospheric ozone mechanism • “bottom-up” coupled air-sea mechanism
Observed Bottom-up only Top-down only Both bottom-up and top-down (Meehl, G.A., J.M. Arblaster, K. Matthes, F. Sassi, and H. van Loon, 2009: Amplifying the Pacific climate system response to a small 11 year solar cycle forcing, Science, 325, 1114-1118.)
Evidence for a lagged (a couple of years) El Niño-like response to peaks in solar forcing White, W.B., Lean, J., Cayan, D.R., Dettinger, M.D., 1997. Response of global upper ocean temperature to changing solar irradiance. J. Geophys. Res., 102, 3255—3266. White, W.B., and Z. Liu, 2007. Resonant excitation of the quasi-decadal oscillation by the 11-yr signal in the Sun's irradiance. J. Geophys. Res., 112, doi: 10.1029/2006JC0040507. White, W.B. and Z. Liu, 2008: Non-linear alignment of El Nino to the 11-yr solar cycle. Geophys. Res. Lett., 35, L19607, doi:10.1029/2008GL034831.. Is this at odds with a La Niña-like response coincident with peaks in solar forcing? (Meehl, G.A.and J.M. Arblaster, 2009: A lagged warm event-like response in the tropical Pacific to peaks in solar forcing in the Pacific region. J. Climate, 22, 3647--3660)
Composite La Niña-like response in year of peak solar followed by El Niño-like response the next couple of years in observations
Why is there a lagged warm equatorial Pacific response? Increased solar forcing around the peaks of the 11 year solar cycle produces a La Niña-like response in SSTs with easterly equatorial wind stress anomalies Poleward shifts of the ITCZ and SPCZ produce westerly wind stress anomalies near 10N and 10S Negative wind stress curl anomalies form near 5N and 5S Wind-driven downwelling ocean Rossby waves propagate to the western boundary, reflect as downwelling equatorial ocean Kelvin waves, and result in El Niño-like SST anomalies lagging the peaks in solar forcing by a couple of years (Meehl and Arblaster, 2009, J. Climate)
Regressing the 11 year solar cycle onto equatorial eastern Pacific SSTs or using filtered data usually shows solar maximum associated with warmer than normal SSTs Composites of tropical Pacific SSTs for peak solar years shows cooler than normal values, followed in the next couple of years by warmer than normal values Is this a contradiction?
Timing is important: peak solar years used in composites occur early in solar max (Roy and Haigh, 2010)
Conclusions 1. Peaks of the 11 year solar cycle forcing produce SST and precipitation anomalies with a La Niña-like pattern in the Pacific 2. Bottom-up coupled air-sea mechanism and top-down stratospheric ozone mechanism add to strengthen tropical convection more than either one alone, and leads to amplifying cloud feedbacks 3. Due to timing of cool SST response to peak solar years early in solar max in composites, correlations and regressions miss this signal in favor of the lagged warm SST response that’s more aligned with the broad decadal solar peak
First mode EOF and reconstructed filtered solar shows warm Pacific lags solar by a couple of years (White et al., 1997, JGR)
Linear regression shows warm eastern equatorial Pacific with solar max (Roy and Haigh, 2010)
White and Liu (GRL, 2008) use 9 solar cycles (band pass filtered for the “QDO”) and band pass filtered observations of equatorial Pacific SSTs (Nino3.4) in an SVD analysis to argue for a resonant response of Pacific SSTs to solar forcing, with cooler SSTs early in the peak QDO followed by warmer SSTs nearer to the broad decadal peak due to “nonlinear phase locking of the third and fifth harmonics near 3.6 and 2.2 years to the first harmonic near the 11 year period”
Idealized repeating sunspot cycle based on 1979-1990, and idealized equatorial eastern Pacific based on Meehl et al. 2009; cool SST with peak solar; broad decadal solar max more aligned with lagged warm SSTs Correlation: +0.47; lag1 correlation: +0.88
Correlation of filtered SST with solar = +0.77; lag1 correlation = +0.98; Due to timing of cool SST response to peak solar years, correlations and regressions miss this signal in favor of the lagged warm SST response that’s more aligned with the broad decadal solar peak
What is it about the peak year of the forcing? What about other years? The cold event-like response is evident the year before and the year after the peaks in solar forcing. The response of the coupled dynamics operates on the timescales of El Niño, on the order of months, so the response is most evident near the peak when the system is being most strongly forced (van Loon and Meehl, 2008, J. Atmos. Sol. Terr. Phys.)
Are these just La Niña events? Are there any differences in the response to solar to differentiate it from La Niña? Troposphere Stratosphere Peak solar La Niña (Cold Events) (van Loon and Meehl, 2008,JASTP)
Univ. Berlin model run with fixed SSTs and specified solar forcing for an experiment for solar max and one for solar min shows effects on western Pacific and Indian Ocean precipitation (January) (Matthes et al., 2006)
______ A mechanism for decadal climate variability in the Pacific (Meehl, G. A., and A. Hu, 2006, Journal of Climate,19, 1605–1623.)
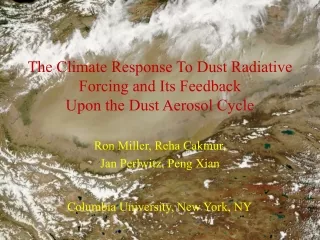
Though global solar forcing from solar min to max is on the order of 0.2 Wm-2, regionally the solar forcing can be greater than 1 Wm-2in the subtropics; cloud feedbacks contribute to fewer clouds in those regions, greater latent heat flux, and trade winds carry moisture towards convergence zones to increase precipitation
Trop Pac 30N-30S: +1.03 Wm-2 net solar (coupled WACCM) +0.06C SST +0.1 Wm-2 net solar (WACCM fixed SST) +0.21 Wm-2 (CCSM3) To get ~0.1C warming, need ~+0.5 Wm-2 (White) TOA solar max to min = 0.2 Wm-2 At surface = 0.4 Wm-2 (taking into account geometry and diurnal cycle) Clouds reduce 2% in coupled WACCM Increase of strat ozone 2%