Download
1 / 31
310 likes | 432 Vues
ISSI International Team Meeting Bern, Switzerland April 20, 2006. Dynamical Response to the 11-Year Solar Cycle (and the QBO) in the Middle Atmosphere. Katja Matthes 1,2 1 Freie Universität Berlin, Institut für Meteorologie, Berlin, Germany

E N D
ISSI International Team Meeting Bern, Switzerland April 20, 2006 Dynamical Response to the 11-Year Solar Cycle (and the QBO) in the Middle Atmosphere Katja Matthes1,2 1 Freie Universität Berlin, Institut für Meteorologie, Berlin, Germany 2 National Center for Atmospheric Research, Boulder, Colorado, USA Marie Curie Outgoing International Fellowship
Possible Ways for Solar Influence on Climate Sun Sun Visible UV Ozone T, U Strat. Strat. trop. trop. Dynamical impact Radiative impact ? Earth Earth Direct Influence Indirect Influence Courtesy of Kuni Kodera (2005)
Change of meridional temperature gradient Influence on ozone Direct influence on temperature Gray et al. (2001a,b) Gray et al. (2003, 2004) Circulation changes (wind, waves, meridional BD circulation) QBO SAO Labitzke (1987), Labitzke and van Loon (1988) ? ? Indirect influence, difficult to measure ? Change of Hadley cell Change of Walker circulation Tropical response Labitzke and van Loon (1988), Kodera (2004), Gleisner and Thejll (2003), Haigh (2003), Haigh et al. (2005), van Loon et al. (2004, 2006), Matthes et al. (2006a) NH polar response Kodera (2002, 2003), Ogi et al. (2004), Kuroda and Kodera (2004, 2006) SH Matthes et al. (2006a) ? Ocean Thermosphere Mechanism – Influence of the 11-Year Solar Cycle UV radiation Mesosphere Stratopause Kodera and Kuroda (2002) Stratosphere Modeling Matthes et al. (2004) Tropopause Troposphere
Positive Correlations Sun - Stratospheric Parameters Labitzke (1999)
NCEP/CPC (1980-1997) 48 km 16 km 60S 60N 60N 60S SSU/MSU4 (1979-2003) ERA40 (1979-2001) 48 km + 1.75K + 0.9 K + 0.5K 16 km 60N 60S Observed Solar Signal in TemperatureAnnual Mean SSU/MSU4 (1979-1997) +2.5 K Hood (2004) Scaife et al. (2002) +0.8 K -1 K +1 K +0.25 K Courtesy of W. Randel (2005) Crooks & Gray (2005)
SBUV (1979-1989) 50km 16km 60S 60N SAGE (1984-1998) 50km 21km Lee and Smith (2003) Observed Solar Signal in OzoneAnnual Mean Models vs. Observations - Tropics Calisesi and Matthes (2006) updated from Shindell et al. (1999)
1000 Eq Observed Modulation of Polar Night Jet and Brewer-Dobson Circulation Anomalies Early Winter Confirmation of modulation during NH winter and tropospheric influence with FUB-CMAM (Matthes et al., 2004, 2006a) ‒ f v*∼ ∇•F ? Kodera and Kuroda (2002)
GCM studies without realistic radiation and ozone changes (e.g., Wetherald and Manabe, 1975; Balachandran and Rind, 1995; Balachandran et al., 1999; Kodera et al., 1991) 2-D chemical transport model studies (Garcia et al., 1984; Brasseur, 1993; Huang and Brasseur, 1993; Haigh, 1994; Fleming et al., 1995) GCM studies with realistic radiation and ozone changes without QBO (Haigh, 1999; Larkin et al., 2000, Shindell et al., 1999, 2001; Rind et al., 2002; Matthes et al., 2003) GCM studies with realistic radiation and ozone changes and with QBO (Matthes et al., 2004, 2006a; Palmer and Gray, 2005) Studies with Chemistry Climate Models Intercomparison within SOLARIS (Solar Influence for SPARC) (Tourpalie et al., 2003, 2005; Rozanov et al., 2004; Egorova et al., 2005; Langematz et al., 2005; Schmidt and Brasseur, 2006; Marsh et al., 2006; Matthes et al., 2006b) Development of Modeling Solar Influence on MA
Perpetual Solar Maximum 15 years Perpetual Solar Minimum +3 % +3 % +2.5 % Experimental Design Ozone changes (%) Annual Mean Irradiance changes max-min (%) Data from Haigh (1994) 5-8 % Data from Shindell et al. (1999) Data from Lean et al. (1997)
GRIPS (GCM Reality Intercomparison Project for SPARC) Solar Intercomparison Annual Mean T (max-min) (K) • Low latitudes: good agreement in stratospheric temperature signal • High latitudes: dynamical signal very different Main result: improvement of model climatology = pre-requisite for realistic solar signal Matthes et al. (2003), Kodera et al. (2003)
Model Description FUB-CMAM • Freie Universität Berlin Climate Middle Atmosphere Model (FUB-CMAM)(Langematz and Pawson, 1997; Pawson et al., 1998, Langematz et al., 2003, Matthes et al., 2004) • T21L34 (5,6 x 5,6), top: 80km (mesosphere) • Ozone climatology • Based on ECHAM model family No self-consistent QBO => Relaxation of the zonal mean wind in the model toward rocketsonde data from Gray et al. (2001)
FUB-CMAM vs. Observations (Max-Min) – NH Winter FUB-CMAM stratospheric response tropospheric response 80 km 0 Matthes et al. (2004) NCEP/CPC (1979-1998) ERA40 (1979-2001) Nov • „poleward-downward“ movement • modulation of the PNJ at high lats Dec • comparable with observations (e.g., Kodera, 1995) Jan 0.1 Feb 0.4 hPa 1000 850 update of Kodera (1995) Gray et al. (2004)
less wave forcing at high lats • lower temperatures at high lats & higher temperatures at low lats => weaker BDC Modulation of the Brewer-Dobson Circulation Correlations: - Vertical Component of EPF (60N/10 hPa) in December and January Temperature Absolut (Min) Matthes et al. (2006a)
Impact on Tropospheric Circulation Pattern Kodera, in preparation (2006) Jo Haigh will talk about stratosphere-troposphere coupling
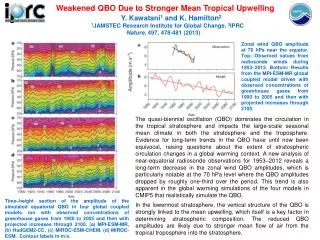
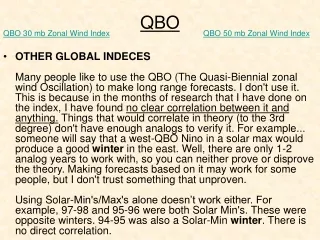
Solar Maximum Solar Minimum cold, undisturbed polar vortex warm, disturbed polar vortex Labitzke (1987), Labitzke and van Loon (1988) Observations: QBO-Solar Signal Holton and Tan (1980, 1982) • Importance of upper stratospheric winds on NH winter evolution: • Gray et al. (2001a,b), Gray et al. (2003), observations and • mechanistic model study, Gray et al. (2004), Palmer and Gray (2005), • Pascoe et al. (2006) GCM study • Observed 11-year solar cycle in QBO itself: Salby and Callaghan (2000, 2006), • Soukharev and Hood (2001), QBOw longer during solar max • QBO modulation confirmed with 2D model (McCormack, 2003) and GCM • (Palmer and Gray, 2005)
Solar Maximum QBO west warmer QBO-Sun Interaction in the FUB-CMAM10hPa north pole temperature +/-2σ Solar Minimum °C E W QBO east warmer • confirms observations from Labitzke und van Loon as well as Gray et al.! • also confirmed with Unified Model with self-consistent QBO (Palmer and Gray, 2005) Matthes et al. (2004)
Model Description UKMO Stratosphere-Mesosphere Model (SMM) • UKMO Mechanistic primitive-equation model of the middle atmosphere (SMM); Midrad radiation scheme, Rayleigh friction • 100-0.01 hPa (16-80 km) • 5° x 5° x 2 km • constant amplitude wavenumber 1 forcing at lower boundary • initial conditions = August • perpetual January conditions • experiments = 300 day long • 20-ensembles in each experiment Courtesy of Lesley Gray (2005)
Polar Temperature at 24 km Experiment A: Varying the Bottom Boundary Experiment B: Varying the Equatorial Winds +40 ms-1 +20 ms-1 100 m 150 m PolarTemperature Time -20 ms-1 200 m 250 m 0 ms-1 Identical -40 ms-1 300 m 350 m Changing the tropospheric forcing or the equatorial winds alters the timing of the warmings Courtesy of Lesley Gray (2005)
Stratosphere Mesosphere Model expt Time-series of polar temperature 20-member ensemble Easterly anomaly imposed in subtropics at 40-50km to mimic a solar minimum anomaly Timing of sudden warmings is very variable in control run Courtesy of Lesley Gray (2005)
Variance of NP temperature at 24 km in UKMO GCM exp. SAO + deep QBO control SAO-only Pascoe, Gray and Scaife, 2006 (GRL) Courtesy of Lesley Gray (2005)
Model Description NCAR-WACCM • NCAR Whole Atmosphere Community Climate Model (NCAR-WACCM)(Collins et al., 2004; Sassi et al., 2005) • 4 x 5L66, top: 140km (thermosphere) • Interactive chemistry • Based on NCAR Community Climate Model family • No self-consistent QBO • Relaxation of the zonal mean wind in the model toward rocketsonde data from Gray et al. (2001) • Very similar experiments as with the FUB-CMAM, perpetual solar and QBO simulations
+0.75K +3% +2.5% +0.2K +1% +0.5K +3% Maxima in temperature and ozone comparable to observations 99% 95% significant relative minimum in the middle stratosphere secondary maximum in the lower stratosphere WACCM Annual Mean Results - DifferencesOzone and Temperature (Max-Min): QBO East experiments Ozone (%) Temperature (K) Matthes et al. (2006b), to be submitted
Comparison NH Winter Response WACCM versus FUB-CMAM • Difference • WACCM: ozone calculated interactively • FUB-CMAM: ozone prescribed
WACCM 4x5 WACCM 1.9x2.5 Matthes et al. (2006b) Zonal Mean Wind Differences - Models vs. Observations Observations NCEP-CPC (1979-1998) FUB-CMAM Nov Dec Jan Matthes et al. (2004)
Jan omega min (hPa/s) +1K Jan omega max-min (hPa/s) 60S 30S Eq 30N 60N WACCM NH Winter Signal - Lower Stratosphere and Troposphere DecT max-min (K) JanT max-min (K) 60S 30S Eq 30N 60N • confirms recent observational study about influence on Hadley and Walker circulation from van Loon et al. (2006)!
Jun omega min (hPa/s) Jun omega max-min (hPa/s) +0.5K 60S 30S Eq 30N 60N WACCM NH Summer Signal - Lower Stratosphere and Troposphere MayT max-min (K) JunT max-min (K) 60S 30S Eq 30N 60N • first model results thatconfirm observational study about influence on Hadley and Walker circulation from e.g., van Loon et al. (2004), Kodera(2004)
WACCM - Impact of Different Horizontal Resolution T90N @ 10hPa U60N @ 10hPa Jul Jul Jul Jul Sep Sep Sep Sep Nov Nov Nov Nov Jan Jan Jan Jan Mar Mar Mar Mar May May May May more SSWs! 1.9˚x 2.5˚ SMIN 4˚x 5˚ SMIN
Summary • Solar cycle and QBO both have anomalies in the subtropical upper stratosphere that can reinforce each other and determine the timing of stratospheric sudden warmings - a frequency modulation (Gray et al., 2003, 2004; Matthes et al., 2004; Salby and Callaghan, 2006) • Direct 11-year solar signal in the upper stratosphere leads to modulation of PNJ and BDC that induce indirect circulation changes in the lower stratosphere (Matthes et al., 2004) and down to the troposphere at polar and equatorial latitudes (Matthes et al., 2006a) • Results obtained with the FUB-CMAM are confirmed with more complex interactive WACCM model (Matthes et al., 2006b) • WACCM shows for the first time lower stratospheric temperaturesignal in Dec/Jan and during summer (modulation of the BDC)! • Prescribed QBO in FUB-CMAM and WACCM is necessary for a more realistic solar signal • vertical structure of temperature and ozone signal captured for the first time in CCM (WACCM) • finer horizontal resolution represents interannual variability better and is needed for better wave-mean flow interactions
Outlook • 110-years time varying solar cycle with and without • time varying QBO • intercomparison of recent solar experiments with • CCMs within SOLARIS (SPARC initiative) • intercomparison of prescribed versus self- • consistent QBO
Thank you to • Karin Labitzke • Ulrich Cubasch • Ulrike Langematz (FU Berlin) • Kunihiko Kodera • Yuhji Kuroda (MRI, Japan) • Lesley Gray (Reading University, UK) • WACCM group (Byron Boville, Rolando Garcia, Fabrizio Sassi, Dan Marsh, Doug Kinnison, Stacy Walters) (NCAR, USA) • Anne Smith (NCAR, USA)