Download
1 / 30
300 likes | 473 Vues
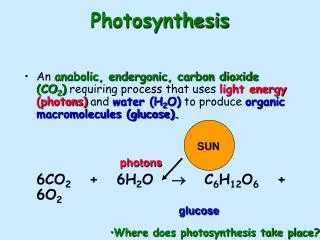
Photosynthesis. Fig. 9-2. Light energy. ECOSYSTEM. Anabolic pathways. The Flow of Energy in Life. photoautotrophs. Photosynthesis in chloroplasts. Organic molecules. CO 2 + H 2 O. + O 2. Cellular respiration in mitochondria. heterotrophs. Catabolic pathways. ATP.

E N D
Fig. 9-2 Light energy ECOSYSTEM Anabolic pathways The Flow of Energy in Life photoautotrophs Photosynthesis in chloroplasts Organic molecules CO2 + H2O + O2 Cellular respiration in mitochondria heterotrophs Catabolic pathways ATP ATP powers most cellular work Heat energy
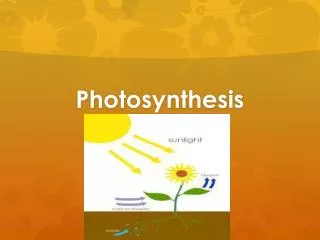
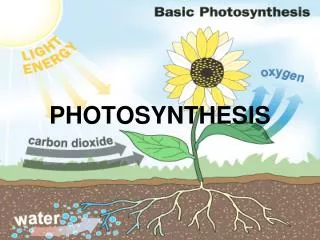
Gas + Liquid = Solid Wood http://msnbcmedia3.msn.com/j/msnbc/Components/Photos/060929/060929_redwood_vmed_4p.widec.jpg • CO2 • H2O • Sunlight • nutrients from soil • a long time http://tree-species.blogspot.com/2008/03/coastal-redwood-tree-sequoia.html Plants as carbon dioxide sinks
Fig. 10-3 Leaf cross section Vein Mesophyll Stomata CO2 O2 Chloroplast Mesophyll cell Outer membrane Thylakoid Intermembrane space 5 µm Stroma Thylakoid space Granum Inner membrane 1 µm
Cellular Respiration vs. Photosynthesis Cellular Respiration Photosynthesis Becomes reduced 6 CO2 + 12 H2O + Light energy C6H12O6 + 6 O2 + 6 H2O Becomes oxidized becomes oxidized becomes reduced But isn’t just the process of cellular respiration in reverse!
Fig. 10-4 Where do the atoms come from? 6 CO2 12 H2O Reactants: 6 H2O 6 O2 C6H12O6 Products: Discovered through experiments with Oxygen isotopes
Fig. 10-5-1 H2O 2 stages: Light Reactions and Calvin Cycle Light NADP+ ADP + P i Light Reactions Chloroplast
Fig. 10-5-2 H2O Light NADP+ ADP + P i Light Reactions ATP NADPH Chloroplast O2
Fig. 10-5-3 CO2 H2O Light NADP+ ADP + P i Calvin Cycle Light Reactions ATP NADPH Chloroplast O2
Fig. 10-5-4 CO2 H2O Light NADP+ ADP + P i Calvin Cycle Light Reactions ATP NADPH Chloroplast [CH2O] (sugar) O2
Fig. 10-7 Light Reflected light Chloroplast Absorbed light Granum Transmitted light
Absorption spectra of photosynthetic pigments Fig. 10-9 Chloro- phyll a Chlorophyll b Absorption of light by chloroplast pigments Carotenoids 400 500 600 700 (a) Absorption spectra Wavelength of light (nm) Rate of photosynthesis (measured by O2 release) (b) Action spectrum Aerobic bacteria Filament of alga (c) Engelmann’s experiment 400 600 500 700
Fig. 10-11 Excited state e– Heat Energy of electron Photon (fluorescence) Photon Ground state Chlorophyll molecule (b) Fluorescence (a) Excitation of isolated chlorophyll molecule
Fig. 10-12 STROMA Photosystem Photon Primary electron acceptor Light-harvesting complexes Reaction-center complex e– Thylakoid membrane Pigment molecules Special pair of chlorophyll a molecules Transfer of energy THYLAKOID SPACE (INTERIOR OF THYLAKOID)
Fig. 10-13-1 Linear Electron Flow Primary acceptor reduced 2 e– P680 oxidized Light 1 Pigment molecules Photosystem II (PS II)
Fig. 10-13-2 Linear Electron Flow Primary acceptor 2 e– H2O 2 H+ + 3 O2 1/2 e– e– P680 Light 1 Pigment molecules Photosystem II (PS II)
Fig. 10-13-3 Linear Electron Flow Primary acceptor 4 Electron transport chain Pq 2 e– H2O Cytochrome complex 2 H+ + 3 O2 1/2 Pc e– e– 5 P680 Light 1 ATP Pigment molecules Photosystem II (PS II)
Fig. 10-16 Mitochondrion Chloroplast MITOCHONDRION STRUCTURE CHLOROPLAST STRUCTURE Diffusion H+ Thylakoid space Intermembrane space Electron transport chain Inner membrane Thylakoid membrane ATP synthase Stroma Matrix Key ADP + P i ATP Higher [H+] H+ Lower [H+]
Fig. 10-13-4 Linear Electron Flow Primary acceptor Primary acceptor 4 Electron transport chain e– Pq 2 e– H2O Cytochrome complex 2 H+ + 3 O2 1/2 Pc e– e– P700 5 P680 Light Light 1 6 ATP Pigment molecules Photosystem I (PS I) Photosystem II (PS II)
Fig. 10-13-5 Linear Electron Flow Electron transport chain Primary acceptor Primary acceptor 4 7 Electron transport chain Fd e– Pq 2 e– 8 e– e– NADP+ + H+ H2O Cytochrome complex 2 H+ NADP+ reductase + 3 NADPH O2 1/2 Pc e– e– P700 5 P680 Light Light 1 6 6 ATP Pigment molecules Photosystem I (PS I) Photosystem II (PS II)
Fig. 10-14 Linear Electron Flow e– ATP e– e– NADPH e– e– e– Mill makes ATP Photon e– Photon Photosystem II Photosystem I
Fig. 10-17 STROMA (low H+ concentration) Cytochrome complex Photosystem I Photosystem II Light 4 H+ NADP+ reductase Light 3 Fd NADP+ + H+ NADPH Pq Pc e– 2 e– H2O O2 1/2 1 THYLAKOID SPACE (high H+ concentration) 4 H+ +2 H+ To Calvin Cycle Thylakoid membrane ATP synthase STROMA (low H+ concentration) ADP + ATP P i H+
Fig. 10-15 Cyclic Electron Flow Primary acceptor Primary acceptor Fd Fd NADP+ + H+ Pq NADP+ reductase Cytochrome complex NADPH Pc • Some bacteria only have photosystem I • Only do cyclic electron flow • What does this suggest about evolution of photosynthesis? Photosystem I ATP Photosystem II • No O2 produced • No CO2 used • Can be photoprotective
Fig. 10-5-3 CO2 H2O Light NADP+ ADP + P i Calvin Cycle Light Reactions ATP NADPH Chloroplast O2
Fig. 10-5-4 CO2 H2O Light NADP+ ADP + P i Calvin Cycle Light Reactions ATP NADPH Chloroplast [CH2O] (sugar) O2
Fig. 10-18-1 Input (Entering one at a time) 3 CO2 Phase 1: Carbon fixation Rubisco 3 P P Short-lived intermediate 6 P P P 3 Ribulose bisphosphate (RuBP) 3-Phosphoglycerate
Fig. 10-18-2 Input (Entering one at a time) 3 CO2 Phase 1: Carbon fixation Rubisco 3 P P Short-lived intermediate 6 P P 3 P Ribulose bisphosphate (RuBP) 3-Phosphoglycerate 6 ATP 6 ADP Calvin Cycle 6 P P 1,3-Bisphosphoglycerate 6 NADPH 6 NADP+ 6 P i 6 P Glyceraldehyde-3-phosphate (G3P) Phase 2: Reduction 1 P Glucose and other organic compounds Output G3P (a sugar)
Fig. 10-18-3 Input (Entering one at a time) 3 CO2 Phase 1: Carbon fixation Rubisco 3 P P Short-lived intermediate 6 P 3 P P Ribulose bisphosphate (RuBP) 3-Phosphoglycerate 6 ATP 6 ADP 3 ADP Calvin Cycle 6 P P 3 ATP 1,3-Bisphosphoglycerate 6 NADPH Phase 3: Regeneration of the CO2 acceptor (RuBP) 6 NADP+ 6 P i P 5 G3P 6 P Glyceraldehyde-3-phosphate (G3P) Phase 2: Reduction 1 P Glucose and other organic compounds Output G3P (a sugar)
Fig. 10-5-4 CO2 H2O Light NADP+ ADP + P i Calvin Cycle Light Reactions ATP NADPH Chloroplast [CH2O] (sugar) O2
Why do leaves turn yellow and red in fall? Fig. 10-9 Chloro- phyll a Chlorophyll b Absorption of light by chloroplast pigments Carotenoids 400 500 600 700 (a) Absorption spectra Wavelength of light (nm) Rate of photosynthesis (measured by O2 release) (b) Action spectrum Aerobic bacteria Filament of alga (c) Engelmann’s experiment 400 600 500 700