1.4 Graphing With Coordinates
1.4 Graphing With Coordinates. Objective: Plot points and lines on a coordinate plane. Standards Addressed: 2.8.8.G: Represent relationships with tables or graphs in the coordinate plane and verbal or symbolic rules. 2.8.8.H: Graph linear function from a rule or table.

1.4 Graphing With Coordinates
E N D
Presentation Transcript
1.4 Graphing With Coordinates Objective: Plot points and lines on a coordinate plane. Standards Addressed: 2.8.8.G: Represent relationships with tables or graphs in the coordinate plane and verbal or symbolic rules. 2.8.8.H: Graph linear function from a rule or table.
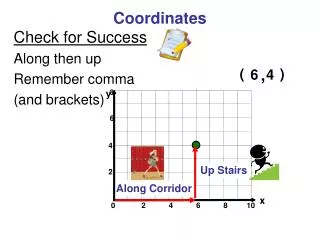
Just as locations can be related to each other with a map, graphing provides a picture of how two variables relate to one another. • A horizontal and vertical number line are used to divide a plane into 4 quadrants. • A plane set up according to this system is known as a coordinate plane. • The horizontal line is called the x-axis, and the numbers on this axis are x-coordinates. • The vertical line is called the y-axis, and the numbers on this axis are y-coordinates. • The intersection of the x-axis and the y-axis is a point called the origin. • The coordinates of a point on a coordinate plane are called an ordered pair. • The origin has coordinates (0, 0).
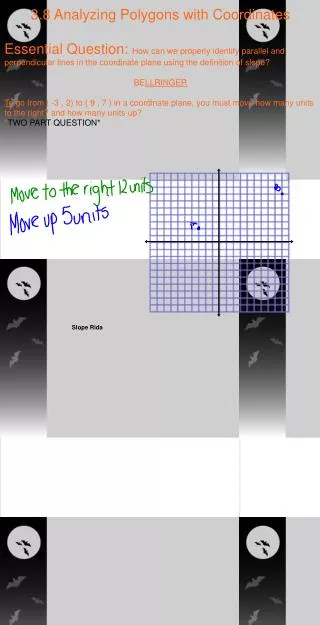
c. Determine the quadrant and coordinates for points G, H, and J on the graph above. d. Graph each of the following points above: K (-3, 8), L (-5, -7), and M (8, -2). C. G (7,7) H (-8, 4) J (-10, -5)
Ex. 3 Make a table for the equation y = 3x, and find the values for y by substituting 1, 2, 3, 4, and 5 for x. Graph the ordered pairs on a coordinate plane and connect the points to make a line.