Current Research
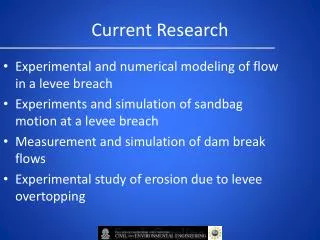
Current Research. Experimental and numerical modeling of flow in a levee breach Experiments and simulation of sandbag motion at a levee breach Measurement and simulation of dam break flows Experimental study of erosion due to levee overtopping.

Current Research
E N D
Presentation Transcript
Current Research Experimental and numerical modeling of flow in a levee breach Experiments and simulation of sandbag motion at a levee breach Measurement and simulation of dam break flows Experimental study of erosion due to levee overtopping
Graduate students: S. Yusuf, M. Elkholy, C. Riahi-Nezhad, L. Larocque, J. Feliciano, L. Alva-Solari
Experimental and numerical modeling of flow in a levee breach
Objectives • To obtain detailed 3-D flow field from measurements in a model levee breach • To measure flow field around submerged structures • To simulate complex 3-D flow field in a levee breach and a flooded urban area using the VOF model
Breach Dimensions 200 ft N W E S 45 ft 465 ft Source: IPET Report 2, https://ipet.wes.army.mil
Physical Model • Scale 1:50 (model: real-life system/prototype)
PhysicalModel Layout 900 GPM Flow Model Scale 1:50
Aerial View of the Physical Model Flow Model Scale 1:50
ADV Velocity measured using 16 MHZ SonTekMicroADV Sampling rate (HZ) …………………..……. 0.1 to 50 Sampling Volume (CC) ………………..…. 0.09 Dist. To sampling volume (cm) ……….. 5 Resolution (cm/s) ….………………………. 0.01 Prog. Velocity range (cm/s) ………..….. 3, 10, 30, 100, 250 Accuracy ………………………………………… 1% of measured velocity, 0.25 cm/s Maximum depth (m) ………………………. 60 Source: http://www.sontek.com/download/brochure/adv.pdf
UVP An Ultrasonic Velocity Profiler (UVP) transducer transmits a short emission of ultrasound, which travels along the measurement axis. When the ultrasonic pulse hits a small particle in the liquid, part of it scatters on the particle and echoes back. Figure 1: This diagram explains the process of data collection by the UVP. The UVP is placed at an angle and reflection of the particles and from the bottom creates a velocity profile.
Velocity Distribution (X7,Y4) and (X7,Y5) (X7, Y4) (X7, Y5) Vx Vx These plots show the velocity in the x direction.
Breach Geometry in Gambit 2.4.6 Inlet (Blue) Outlet (Red) Houses (solid Blocks) Arrows shows the direction of flow
Mathematical Model • General • Ansys Fluent 6.3.26 used for modeling of levee breach flows • Solver: Pressure based • Multiphase model: VOF (Implicit scheme) • Turbulence model: k-epsilon • Grid specification • Boundary layer : meshed at the bottom of the channel • Grid: hexahedral with size = 2 cm
Ongoing and Future Research Flow measurements around model buildings using UVP Comparison of computed and measured velocity distributions Characterization of turbulence over irregular topography Inclusion of erosion and deposition of channel bottom and sides
Tracking Sand Bag Motion in a Levee Breach using DPTV Technique
Objectives • Developing a visual technique for tracking the motion of the sand bags and plotting their trajectories. • Determining the three-dimensional velocity components of the sand bags. • Formulating relationships between the sand bag size and shape and flow parameters. • Determining optimum sand bag size, and more efficient procedures for levee closure.
Trials for breach closure Source: http://www.usace.army.mil/katrina-images/NO-A-09-04-05_0072.jpg
Katrina Model 3.05 m 1.22 m Flow 2.83 m
The Model Sand bags Elevation Plan view Weight (gm) Equivalent Dia. (mm) Equivalent prototype weight (Ib) 1:50
Camera-axis 1 Camera-axis 2 x2 x1 o1 a1 o2 a2 Image Plane 3-D Stereoscopic System S f x1 LensPlane x2 d z Water surface x o dz a dx
Testing of extraction of sandbag in stationary flow Centroiding After Extraction
Bed Elevation Contour Map for the Katrina Model 9.70 – 16.1 16.1 – 19.1 19.1 – 22.3 22.3 – 25.7 cm Datum: Top of the U/S levee Ditch x x x x x U/S Levee D/S Levee 1 2 3 4 5 Canal
Trajectories of 10,000 Ib sandbag at different locations (Plan view) 1 4 5 2 3
Trajectories of 10,000 Ib sandbag (vertical direction) Location (1) Location (3) Time (sec) Time (sec)
Ongoing and Future Research Understanding the general mechanics of sand bag motion. Formulating relationships between the sand bag size and shape and flow parameters. Determining the optimum size of sand bags and procedures for levee breach closure.
Experimental and Numerical Investigations of Dam-Break Flows
Objectives • To measure the instantaneous velocity over time for a dam break experiment. using an Ultrasonic Velocity Profiler (UVP) • To conduct LES simulation of a dam break wave. • To compare the measured and simulated flow field Figure: Experimental dam break set up. Notice the left hand side of the dam is filled with water up to 25 cm.
Experimental Set up • Flume: 7.67 m long, 25 cm deep, 18 cm wide, and 3.5% slope. • UVP placed at 45 deg. (schematics shown below). • UVP start measuring velocity as dam is lifted Experiment 1 Experiment 2 UVP Probe UVP Probe UVP probe facing upward to determine water level over time UVP probe facing downward to find the velocity profile at the bottom of a dam break wave
Numerical Set-up Volume: WATER Volume: AIR The grid used in the numerical simulation. The blue grid indicates the water and the other portion is the air at the initial location. A numerical grid with two separate volumes (water and air) was generated using Gambit, a grid generating program. The numerical simulation was conducted using FLUENT. Large Eddy Simulation (LES) and Volume of fluid (VOF) models were used.
Experimental Results T=1.0s This graph shows the velocity profile measured using a UVP. The two lines represent two separate trials of the experiment. The UVP continuously measures the velocity over time and generates a velocity profile at a specified time step. Multiple trials were conducted to compare the repeatability of the experiment.
Comparison A comparison between the numerical simulation and the experiment velocity profile on the upstream side of the dam break
Ongoing and Future Research Additional measurements throughout the model Experimental measurements of flow field including erosion and deposition following dam failure. Simulation of flow field following dam failure including erosion and deposition of bottom material
Objectives To understand and identify the parameters that govern the erosion and headcut formation during the overtopping of a levee. To conduct laboratory experiments overtopping small-scale dikes in a flume. To collect and evaluate the data and improve/modify breach models.
Instrumentation Video Camera Top Video Camera UVP Sensor Upstream Front Video Camera Data Acquisition UVP Sensor Downstream