Download
1 / 54
540 likes | 673 Vues
The Texas Lyceum 2011 Public Conference. Britt Harris Chief Investment Officer January 28, 2011. We Are Servants of the People. The Responsibility is Significant and Shared. 3. It is a Sacred Duty to Perform. The Most Important Product for Our State. Our Children.

E N D
The Texas Lyceum 2011 Public Conference Britt Harris Chief Investment Officer January 28, 2011
The Most Important Product for Our State • Our Children
Texas Pension Systems 100% Source: Pew Center Report
2008 Overall State Funding Ratios Source: PEW Center on the States, 2010
U.S. Employment Growth Moderate RecoveryNovember 2010 v. December 2009 GrowthRate Below -2% -1.9% to -1% -0.9% to 0% 0% to 0.9% 1% to 1.9% 2% and above Source: BLS, seasonally adjusted preliminary year-to-date growth rates Source: BLS, seasonally-adjusted preliminary year-to-date growth rates
Projecting Long-Term Returns • What time period? • How much can bonds help? • Starting valuations for equity investments?
Time Horizon Texas Teachers Long-Term Returns 8.0% Source: State Street
Changes in Interest Rates 1982-2010 10 Year U.S. Treasury Yield to Maturity 10.3% 8.0% 6.41% 3.3% Bond ReturnsEquity Returns 1990’s 7.8% 1990’s 17.5% 2000’s 5.9% 2000’s 1.4% Source: Pew Center Report
Earning 8% Risk Premium Required Above Treasury Bonds Source: Bloomberg, LTM P/E
Shiller P/E Ratio Source: Deutsche Bank, GFD
The Great Moderation U.S. Debt to GDP back to 1929 Source: Deutsche Bank, Bloomberg, BEA, Federal Reserve
Texas Teachers Investment Management Division Investment framework Economic backdrop Skill level Risk management
Overview of Investment Results Periods Ending December 31, 2010 (Preliminary Results) Real Return20% Policy weights: 8% - TIPS2% - Commodities2% - REITS8% - Real Estate/Real Assets Stable Value20% Policy weights: 15% - Long Treasuries4% - Hedge Funds1% - Cash Global Equity60% Policy weights: 22% - US Large Cap5% - US Small Cap15% - Non- US Developed10% - Emerging Market Equities8% - Private Equity • Trust Value over $100 Billion • Strong fourth quarter (up 5.6%) • Solid year (up 14.7%) • Trust Performance generally consistent with Economic Regime • Deflation / Inflation Strategies are both near $20 billion • Peer Results: 1st percentile through September 2010 Source: State Street Bank.
Portfolio Diversification in Different Market Conditions 4th Quarter 2010 Benchmark Results Global Equity: 10.7% Stable Value: -5.4% Real Return: 5.0% Global Equity Regime Favorable GDP/CPI 70% of observations Average Inflation: 3% Global Equity: +17.2% Stable Value: +7.3% Real Return: +9.6 % Real Return Regime High CPI, Low GDP 13% of observations Average Inflation: 8.1% Global Equity: -1.1% Stable Value: +9.2% Real Return: +13.7% Stable Value Regime Stagnant GDP & Low CPI 17% of Observations Average Inflation: 1.1% Global Equity: -4.5% Stable Value: +11.8% Real Return: -3.3% Source: Data from Bureau of Labor Statistics (CPI) and Bureau of Economic Analysis (GDP). Graph depicts year-over-year quarterly observations from 1948 to date. Market returns based on TRS policy, dependent on QOQ inflation and GDP prevailing since 1990.
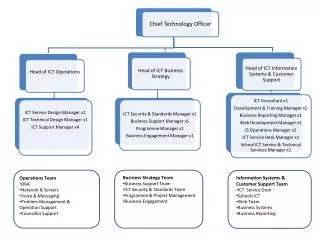
Investment Management Division Organizational Structure Chief Investment Officer Deputy Chief Investment Officer Trade Management Group *Claudia Williams Operations/Trust Performance *Sylvia Bell Reporting Patricia Cantu Technology David Cox Human Resources – Susan Wade * IIC Voting Members
Largest Retirement PlansAs of September 30, 2009 Source: Pensions & Investments.
TRS Trust LiquidityAs of December 31, 2010 (Dollars in Billions) TRS has sufficient funds until 2072 Source: IMD Performance Analytics.
Pensions are “Strong Hands” • Large • Long-term • Not levered • Liquid
The Future Normal market cycles Projections for 2010 Longer-term projections
S&P 500 Bear MarketsAs of 1926-Present Source: Leuthold Group, January, 2011
Wealth Destruction Source: Federal Reserve Flow of Funds
S&P 500 Bull MarketsAs of 1926 to Present * As of 12/28/09 High Source: Leuthold Group, January 2011
Projections for 2011 Source: Bloomberg; accessed January 27, 2010
2011 Public Partner Top 5 Ideas One Year Three Years Emerging Markets Large Cap Emerging Markets Large Cap Commodities Quality Real Estate Quality Distressed Debt Commodities Least Attractive Most Attractive Treasuries Treasuries Non U.S. Sovereign Debt Emerging Markets Non U.S. Sovereign Debt Credit: Investment Grade Emerging Markets Gold Currency: Non U.S. Developed Credit: Investment Grade Source: TRS Investment Network, December 2010
10-Year Annual Return Forecast SurveyAs of November 30, 2010 Source: Strategic Partners and TUCS.
GMO 7-Year Asset Class Return Forecasts*As of December 31, 2010 *The chart represents real return forecasts1 for several asset classes. These forecasts are forward-looking statements based upon the reasonable beliefs of GMO and are not a guarantee of future performance. Actual results may differ materially from the forecasts above. 1 Long-term inflation assumption: 2.5% per year. Source: GMO
A Modified Future Modified by Debt Modified by Demographics Modified by Globalization
The Great ModerationU.S. Debt to GDP back to 1929 Source: Deutsche Bank, Bloomberg, BEA, Federal Reserve
U.S. Household Credit Market Debt % of GDP Latest data is 3Q10 Sources: Rosen Consulting Group. BEA, Federal Reserve
Mortgage Foreclosures in Process by Loan Type 16.7% 13.3% 9.0% 3.6% 2.3% Latest data as of October 2010 Sources: LPS Applied Analytics, RCG 35
Personal Consumption and Savings Recovery depends on consumption Savings rate remains high relative to recent past Source: Goldman Sachs 36
Growth in Population Aged 65+ % of Total Millions Source: Census
Global Demographics Percentage Change in Overall Population Percentage Change in Economically Active 15-64 Year-old Group 38 Source: Deutsche Bank, UN Population Division
U.S. Immigration by Decade Millions *Estimate Sources: Immigration Naturalization Service, RCG 39
Emerging Markets vs. Developed Markets The major emerging economies continue to perform far better than the developed economies Real GDP (developed economies) Real GDP (emerging economies) China Pre-recession peak in global activity India Pre-recession peak in global activity Brazil Korea U.S. Index, 100 = Q2 2008 Index, 100 = Q2 2008 Eurozone Japan U.K. • Emerging markets in expansionary phase. • Developed markets in recovery phase. 40 Source: National sources, J.P. Morgan. Data as of Q3 2010
United States Trade Balance with China1986 to 2010 $Billions Latest data as of November 2010, annualized YTD number Source: Rosen Consulting Group, Census
Global Output Gap Tightening expected in emerging markets • Developed markets monetary policy to remain easy 42 Source: GS Global ECS Research
Public Debt as a Percentage of GDP 43 Source: DB Research, Deutsche Bank
The Great Moderation Out of Ammo Slower GDP Growth (Secular) Renewed Economic Volatility Increased Global Integration Heightened Competition 44
The Great Moderation • Rolling 25-Year Real and Nominal Return of 50/50 Split of US Treasuries and • Equities Source: Deutsche Bank, GFD
Slow Rise in Non-Farm Employment Source: Goldman Sachs
Fiscal Woes in Developed Countries Source: Ned Davis 47
Corporate Cash Near Record Highs Source: Ned Davis • If recovery gains ground expect to see • Increased dividends • Share repurchases • Mergers & acquisitions • Capital Expenditure • Hire workers/increase compensation • Keep it 48
Profit Margins S&P 500 profit margin Labor compensation/corporate value added 10 70 9 68 8 66 7 Net margin (%) Share (%) 6 64 5 62 4 60 3 2 58 Source: S&P, UBS, J.P. Morgan. Data as of Q3 2010. Source: Bureau of Economic Analysis, J.P. Morgan. Data as of Q2 2010. Profit margins at historical highs Labor cost declined by around -1.9% in 2010 Source: JP Morgan 49
Expect to Win Time and Talent Ingenuity and Innovation Honor and Dedication Prudent Incentives rather than Restrictive Regulations 50