Download
1 / 26
260 likes | 394 Vues
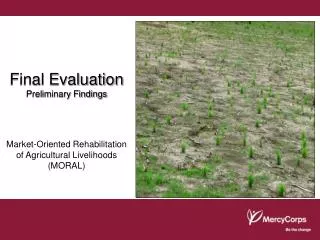
Evaluation Overview and Findings From An Interim Evaluation of Grants to Green. Presented by: Highland Communications, LLC Jennifer Ballentine, MPH October 29, 2009 . Purpose of the Evaluation. To monitor implementation and measure success towards desired outcomes

E N D
Evaluation Overview and Findings From An Interim Evaluation of Grants to Green Presented by: Highland Communications, LLC Jennifer Ballentine, MPH October 29, 2009
Purpose of the Evaluation To monitor implementation and measure success towards desired outcomes Increased efficiency Cost savings Increased awareness of environmental sustainability Findings will be used for: Ongoing quality improvement Sustainability planning Promoting public will and policy Informing decision making
Evaluation Principles • We focus on results, use data to make decisions and then act on these decisions • We value all input from our grantees • We will draw on the wisdom and experience of our grantees • We will share and disseminate results • We will respect the rights and confidentiality of grantees • We will use grantees’ time judiciously • We will honor environmental sustainability in our evaluation approach
Monitoring and Evaluation Methods Initial Review of Grant Agreement Baseline survey Interim survey Final survey End-of-grant period site visit Monthly monitoring and review of utility bill data Monitoring of web seal placement
Findings from an Interim Evaluation • Methods • Online survey • Analysis of utility bill data for Cycle 1 grantees • Monitoring visits with Cycle 1 Implementation Grantees • Time Frame • Data collected in May-June 2009 • Findings presented to Advisory Board in August 2009
Assessment Grantees Cycle 1 (September 1, 2008 – September 1, 2009) 19 applicants 12 grantees (approx. $4,000 per grantee = $48,000) 100% grantees completed Cycle 2 (March 1, 2009 – March 1, 2010) 13 applicants 12 grantees (approx. $4,000 per grantee = $48,000) 100% grantees completed Cycle 3 (July 1, 2009 – July 1, 2010) 25 applicants 16 grantees (approx. $4,000 per grantee = $64,000) In progress
Implementation Grantees Cycle 1 (September 1, 2008 – September 1, 2010) 14 applicants 10 grantees ($342,000 awarded, $304,500 matched*) 50% of grantees completed Cycle 2 (March 1, 2009 – March 1, 2011) 10 applicants 9 grantees ($347,126 awarded, $336,068 matched*) In progress *Match rate = $1 to $1 for operational budgets $500K+ .50 to $1 for operational budgets $250K-$499K
Change in Knowledge Average Level of Knowledge 1= Little or No 5= A Lot N=20 Knowledge Indicator
Green Practices in Place Before and After Grants to Green Percent N=20 Type of Practice
Green Policies in Place Before and After Grants to Green Percent N=20 Type of Policy
Number of Communications, Presentations and Panels Number Type of Effort N=20
Utility Data Sample 6 Implementation Grantees Includes 50% who fully completed project Includes 50% who partially completed project 10 Assessment Grantees
Implementation Grantees’6 Month Actual Cost Savings Annual Utilities *16% decrease, including 0-2 months of no implementation
Implementation Grantees’ Annual Projected Cost Savings Annual Utilities *20% decrease, projection based on actual savings rate
Implementation Grantees’ Energy Savings -Annual Savings will continue year after year Energy Saved is the annual equivalent of: - Lbs of Coal Saved: 430,858 - Lbs of CO2: 963,064 - Cars removed from road: 104 for 1 year (12,000 miles)
Woodruff Arts Center • Goal: Annual Savings of $49,395 • Award: $40,000 • -Six Months of Savings: $26,310 • -Projected Annual Savings: $51,758(25%)
The Galloway School -Goal: Annual Savings of $6,538 -Award: $25,000 -Six Months of Savings: $7,879 -Projected Annual Savings: $8,740 (12%)
Georgia Citizens Coalition on Hunger • -Goal: Annual Savings of $3,921 • -Award: $50,000 • Six Months of Savings: $2,593 • Projected Annual Savings: $3,002 (4%) • -Provided AC for community gym
The Open Door Community -Goal: Annual Savings of $1,100 -Award: $9,000 -Six Months of Savings: $-143 -Provided AC for kitchen and dining room serving homeless
Assessment Grantees’ Projected Annual Cost Savings Annual Utilities *8%decrease, $59,678projectedannual cost savings
Selected Assessment Grantees’ Cost Savings $53,000 Annual Savings *No data, or not applicable
Where is Grants to Green Going? • 30 Energy Assessments Completed (includes 6 pilots) • 19 Implementation awards granted • $503,520 Annual Savings Opportunities Found • $150k of opportunities pay for themselves in 6 months or less • 16 Assessments in progress • 14-16 Assessments starting in January 2010 • Additional Implementation awards to be granted in 2010
Evaluation Limitations • Survey responses dependent on respondent’s knowledge, understanding of program and recall • Analysis of energy and cost savings only includes Cycle 1 grantees • Analysis does not take into account other factors such as staff changes, changes in hours of operation, etc. • 10 Implementation grantees only eleven months into two-year grant period
Conclusions • Grants to Green has significant impact on: • Knowledge, practices and policies related to green building • Energy usage and cost • Savings will grow over the years • With continued support, Atlanta’s non-profit community can be a leader in the environmental sustainability movement