
Flow Repositioning
E N D
Presentation Transcript
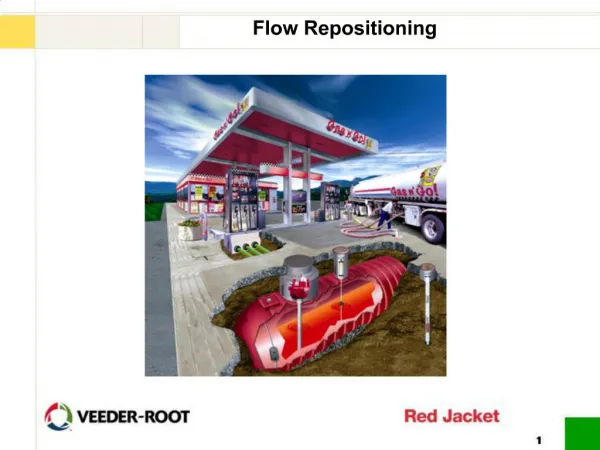
1. Flow Repositioning
2. System Head Losses- Diagram Causes of Dynamic Head Losses- At Higher Flow Parts of the System
Leak Detector
Valves
Piping Trunk
Piping Branches
Causes of Dynamic Head Losses- At Lower Flow Parts of the System
Dispenser, meter
Breakaway
Filter
Hose
Nozzle
Swivels
3. The Flow System - Resistance to Flow Pump and Motor in the tank create pressure to overcome resistances to flow. The two types of resistances are �static head� and �dynamic head�
Static Head
The effect of static head does not vary with the flow rate
The height that a fluid must be lifted. This is the distance from the product in the tank to the point of discharge into a car tank or loading rack discharge point.
In the submersible pumping system that distance is taken as the worst case scenario of a nearly empty tank
In bottom loading applications the highest point in the tanker is taken as the point of discharge.
The static head may vary with the tank level. The resulting variation can make a difference of 7- 11 ft, or about 2-3psi in the pressure of a pump.Usually the rest of the station configuration will keep the static head requirement constant.
4. Static Head in a Retail Fueling System Static Head includes:
Product level to the packer,
Bury depth
rise in grade to the islands
Height to discharge point
5. Overview - Dynamic Head Resistance in Flow Systems Dynamic Head-
What is Dynamic Head
Dynamic Head is resistance to the movement of product from the tank to the nozzle caused by fueling system components
This resistance varies with the flow rate of the product through the component. The higher the flow rate, the higher the resistance
The relationship between the pressure and resulting flow is exponential and not proportional. (twice the flow requires four times the pressure, not twice the pressure.)
The resistance profile of each component causes a decrease in head or pressure as fluid passes through that component. The pressure at the pump starts at a higher value and every component the product passes through decreases the pressure at that point until the pressure is �0� at the point of discharge.
Total system resistances vary depending on the total flow passing through the component.
Component resistances are additive and can be translated into a total pressure loss for the system.
6. Overview - Dynamic Head Resistance in Flow Systems Dynamic Head
Components That Create Dynamic Flow Resistance in a Retail Fueling System-
Any component that has product flowing through it affects the total resistance or dynamic head of the system
Piping-
The trunk (closest piping to the submersible pump) has the highest flow rate
The branches have less flow through them (only those nozzles and dispensers on that line segment)
Flexible Connectors
Accessories:
Leak Detectors
Valves, such as check valves, ball valves
In-line filters and screens
Safety Valves
Dispensers and �Hanging Hardware�
Dispenser losses, including meter, filters
Nozzles
Hoses
Breakaway fittings
Swivels
Usually about 2/3 of the resistance of a flow system is due to hanging hardware.
7. Dynamic Head Losses of Components Notice that the head increases exponentially, not proportionally. Increasing the pressure by a factor of 4 only increases the flow by a factor of 2. This is true for all the components of the flow system that the product flows through.
Piping size is important in the areas of the piping system that have the potential to carry the highest flows�generally near the pump.
8. 2/3 of the head loss at the island is due to �Hanging Hardware� nozzles, hoses breakaways Dynamic Head Losses of Components
9. Pressure & Head Relationship Pumps will pump all fluids to a maximum height at no flow condition or at called dead head (in this example�100 ft.).
Depending on the fluid, even though the height a pump can push to is the same, the pressure at the pump is different. Heavier products, such as diesel will exhibit a higher pressure than lighter products such as gasoline.
10. To convert the feet of head to pressure Divide 2.31 by S.G of the new fluid to get feet of product per PSI for that fluid Example Calculations:
Calculate the feet of product that exert 1 psi pressure of static head: Divide 2.31 by S.G to get feet of product per PSI.
Gasoline: 2.31 ft per psi / .71 s.g=. 3.25 ft per psi
Diesel: 2.31 / .85 s.g.= 2.72 ft per psi
(remember water has a specific gravity of 1)
Calculate the fluid pressure from head curves: Divide ft head from curve by 2.31 and multiply times S.G:
Gasoline: (100 ft. /2.31)X 0.71=30.7 PSI
Diesel: (100 ft /2.31)X0.85=36.8 PSI Pressure & Head Relationship By showing the pump output in head of feet it makes it easier to express the pressure in one graph. If pressure was used, there would have to be a separate graph for every fluid differing in specific gravity.
If a pump were to pump into a pipe extending vertically it would keep lifting the product to the feet of head shown at no flow. This is commonly called shut-off head. Although the vertical lift is the same in this condition, the pressure at the pump, at the bottom of the column of liquid would be higher for a heavier product.By showing the pump output in head of feet it makes it easier to express the pressure in one graph. If pressure was used, there would have to be a separate graph for every fluid differing in specific gravity.
If a pump were to pump into a pipe extending vertically it would keep lifting the product to the feet of head shown at no flow. This is commonly called shut-off head. Although the vertical lift is the same in this condition, the pressure at the pump, at the bottom of the column of liquid would be higher for a heavier product.
11. Overview � Universal Motor and Pump (UMP)
12. Motors
Motors can be fixed speed or variable speed and drive the pump section of a UMP.
Fixed speed motors run at a fixed rpm. Pumps attached to them have one fixed output curve.
Variable speed motors can be controlled to generate a constant pressure output on the pumps they are attached to. Pressure output varies with the desired output programmed into the controller. The higher the rpm of the motor, the higher the output pressure of the pump.
Overview � Universal Motor and Pump (UMP)
13. Pumps
Centrifugal pumps create pressure by accelerating fluid from the center of a spinning impeller to the outer perimeter
They may have several stages, each of which imparts increasing pressure to the fluid being pumped comprising of the parts below.
Each stage typically has 3 parts:
Impeller- is spun by the motor. Product enters at the central �eye� and is accelerated to the perimeter � producing pressure
Diffuser- directs the fluid leaving the impeller to the center of the pump, into the eye of the next stage�s impeller.
Diffuser plate- With the diffuser, the diffuser plate encloses the impeller, forming one stage.
Overview � Universal Motor and Pump (UMP)
14. Impellers spins fluid outward, accelerating it and creating pressure
Diffusers redirect product to the eye of the next impeller
About 14-15 P.S.I. is created in each stage in 60 hz pumps and about 9-10 psi in 50 hz pumps
15. Methods For Increasing Flow
Increase the speed � higher HP motor
Increase the diameter
Increase the vane width
Methods for increasing the output pressure of an impeller or pump
Increase the speed � higher HP motor
Increase the diameter of the impeller
Additional stages add incremental output pressure to the pump
16. STP - Pump Performance Curves Pump performance curves typically show pressure in the form of �HEAD�on the left Y axis and flow rate on the X bottom axis.
The head , or pressure on the Y axis represents the pressure at which the pump can deliver the flow rate on th X axis.
17. Example: Against a head (pressure) of 60 ft, a 1 � hp pump will deliver 58 gallons per minute
The pump cannot vary from this curve. When running, it supplies the flow it can against the pressure it experiences in the flow system STP - Pump Performance Curves
18. The pump cannot vary from the flow curve �
Changes in upstream components to reduce frictional pressure loss will improve overall system flow by reducing the amount of pressure the pump must overcome to deliver flow at the nozzle
As the pressure requirement decreases, the amount of flow a pump can deliver increases
The analogy is a garden hose that is throttled with a thumb. With a lot of pressure against the hose, there is very little flow. As the pressure against the hose is relaxed, the flow from the hose increases.
19. Variable speed pumps have multiple programmable set points for desired output pressure.
They will follow the chosen curve by slowing or speeding up the motor to react to the varying system flow resistances.
The pressure holds constant until the load is too great for the pump to maintain the pressure. STP - Pump Performance Curves
20. Manifolded Pump curves are Additive on the flow Axis (X axis)
Actual flow rate increase depends on the other system components
Adding manifolded pumps will not increase flow in an additive manner at the nozzle due to the pressure loss created by other system components STP - Pump Performance Curves
21. The Static and Dynamic Losses in the Pump Flow Program A= Static head
B=Leak Detector loss
C=Piping Loss
D=Dispenser loss
E= Hanging Hardware loss The equipment head losses are additive to make up a total system head loss curve.