Download
1 / 42
420 likes | 583 Vues
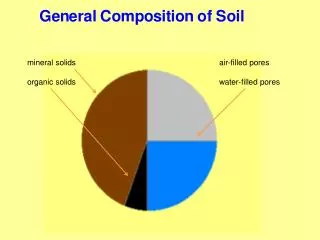
mineral solids air-filled pores organic solids water-filled pores. Figure indicates ½ total volume is pore space, or 0.50 porosity. This varies from soil to soil. Figure shows ½ of pore space filled with water. This depends on recent rain, internal drainage and evapotranspiration.

E N D
mineral solids air-filled pores organic solids water-filled pores
Figure indicates ½ total volume is pore space, or 0.50 porosity. This varies from soil to soil. Figure shows ½ of pore space filled with water. This depends on recent rain, internal drainage and evapotranspiration. This is a mineral soil. There are organic soils. For a mineral soil, the indicated amount of organic matter is higher than typical. Problem Assume the average density of solid particles = 2.60 g / cm3 and porosity = 0.50. What is the density of this soil when it is dry (zero water content)? bulk density = 1.30 g / cm3
High bulk density is bad for plants because it impedes root development. A dense zone therefore restricts the volume of soil occupied by roots, increasing susceptibility to drought. You can determine bulk density by taking a core sample (known volume), drying in oven to evaporate water, then weighing. Often people assume a value of 2.65 g / cm3 for the density of solid particles, determine bulk density, then calculate the porosity from, porosity = 1 – (BD / PD) The water content of the core sample can determined by weighing fresh from the field besides when oven-dried. gravimetric water content = mass of water / mass of dry soil volumetric water content = volume of water / volume of soil (core)
The mineral particles range in size. Excluding particles gravel-size and larger, the fine-earth particles include sand, silt and clay sizes. Sand 2.000 mm – 0.050 mm Silt 0.050 mm – 0.002 mm Clay < 0.002 mm Texture is the proportion of sand, silt and clay. Crudely speaking, there are sandy soils, loamy soils and clay soils. However, since texture strongly affects many other properties, people split textural classification further into 12 textural classes. The main effect of texture on other soil properties is through particle surface area. Decreasing size of particles (sand → clay), greatly increases surface area. Greater surface area means greater chemical and physical reactivity, like retention of nutrients and capacity to hold water.
Adsorption and Exchange of Ions The clay-size particles typically have formed in the soil from prior minerals by chemical weathering. Besides just large surface area, the clay minerals have the specific capacity to adsorb positively (mostly) and negatively charged nutrient and other ions because they carry electrostatic charge. The adsorbed ions are in chemical equilibrium with ions in the soil water (solution), meaning that there is more or less free exchange. The humus fraction of soil organic matter behaves similarly.
The cations shown are typically the most common ones in soil. Of these, Ca2+, Mg2+ and K+ are important nutrients and are called base cations to distinguish them from acid cations (e.g., H+). Al3+ is also an acid cation because when it reacts with water, H+ is produced. Within a volume of soil, the amount of cations, bases or acids, adsorbed onto clay minerals and humus, is many times greater than the amount these cations in the soil solution. Adsorbed nutrients are a reservoir –when nutrients in the soil solution are depleted by plant uptake, they are replenished by release from clay minerals and humus. An important concept pertaining to adsorbed cations is cation exchange capacity, CEC. This is the amount of adsorbed cation charge per mass of soil (cmol(+) / kg). It includes charge due to both acid and base cations.
Soil Reaction, Acidity, Alkalinity and pH Adjustment Intuitively, if a soil is dominated by acid cations, H+ and Al3+ (and others), it is acid, has relatively little nutrient base cations, Ca2+, Mg2+, K+ (and others) and is chemically infertile. Percentage base saturation, %BS = (charge due to bases / CEC) x 100 The level of acidity, as measured by soil solution pH, is related to the %BS in what is called a buffer curve. Shape varies from soil to soil but pH always increases as %BS increases. To refresh memory: pH = -log [H+] So, low pH means large [H+] and high acidity.
The below data are for an acid sandy loam in North Louisiana: Base Cations Acid Cations ----------mmol (+) / 100 g or cmol (+) / kg ---------- Ca Mg K Na Al H 2.0 0.6 0.3 0.1 6.4 0.6 CEC = ? and % BS = ?
USDA NRCS categories pH < 4.5 extremely acid 4.5 – 5.0 very strongly acid 5.1 – 5.5 strongly acid 5.6 – 6.0 medium acid 6.1 – 6.5 slightly acid 6.6 – 7.3 neutral 7.4 – 7.8 mildly alkaline 7.9 – 8.4 moderately alkaline 8.5 – 9.0 strongly alkaline > 9.0 very strongly alkaline Most plant do best in pH range 5.5 – 7.0, though some do better under more acidic or basic conditions. Especially high or low pH bad for plant directly and indirectly through effects on the solubility and plant-availability of other nutrients besides Ca2+, Mg2+ and K+, like P, B, Mo, Fe etc. Also, high or low pH adversely affects beneficial soil microorganisms involved in nutrient cycling (release of nutrients bound in organic matter) and others that carry out N-fixation.
Therefore, an important soil management practice is pH adjustment. Just how much base or acid that needs to be applied depends on initial and target pHs, shape of the buffer curve and the CEC. In practice, different amounts of base or acid are added to a set of soil samples and the pH measured to develop a response curve. Different lime materials may be used to neutralize soil acidity and raise pH. CaCO3 calcitic limestone CaMg(CO3)2 dolomitic limestone CaO burned lime (quicklime) These latter two are more soluble Ca(OH)2 hydrated lime so react faster. To lower pH, sulfur (S) is typically added. Although it is not itself an acid, it is oxidized in the soil (primarily by certain microorganisms) to produce sulfuric acid, H2SO4.
Fertilizer Recommendations The nutrients most commonly applied are N, P and K because these are the most commonly deficient with respect to crop needs. Some states have recommendations for N based on soil tests for N. Louisiana does not. The problem with N is that the overwhelming amount of soil N is bound in organic matter. Release of this N depends on microbial activity, which is highly variable. In Louisiana and some other states, N recommendations are based on long-term data for crop response to different rates of N fertilization. Some states have found that the concentration of soil nitrate-N (NO3-) can be used to make recommendations.
Based on the relationship between yield and soil test, you need to add sufficient fertilizer P to raise the soil test from 3 to 18 if you want to increase expected yield from 50% to 90% of max. The recommendation is in terms of pounds P / acre. When soil test concentrations of a nutrient are used, crop growth/yield are plotted with respect to soil test value and modeled. Relative Yield (%) Soil Test P (ppm)
Assuming you wanted to apply 120 lbs of N per acre and used a 12-12-12 fertilizer that cost $ 400 per ton (2000 lbs), how much would it cost to fertilize a 40 acre tract? You need 40 ac x (120 # N ac-1) / (0.12 x 2000 # N ton fertilizer-1) = 20 ton fertilizer costing 20 ton x $ 400 ton-1 = $8000 Things you need to know about fertilizer grade, e.g., 12-12-12. In order, the numbers refer to % N, % P2O5 and % K2O in it. However, there is no P2O5 nor % K2O in it! It does, of course, contain P and K but not in these forms. This representation is highly misleading because these oxides weigh much more than the elements they represent. You have to use conversion factors, 0.44 and 0.83 for P and K, respectively.
Continuing with the above scenario, how much P and K are applied along with the 120 lbs of N per acre? Conversion factors for P2O5 and K2O are 0.44 and 0.83, respectively. You apply the 12-12-12 fertilizer at a rate of 0.50 ton per acre, so you apply, # P ac-1 = 1/2 ton fertilizer x (0.12 x 2000 # P2O5 ton fertilizer-1) x 0.44 = 53 # P ac-1 # K ac-1 = 1/2 ton fertilizer x (0.12 x 2000 # K2O ton fertilizer-1) x 0.83 = 100 # K ac-1
Some Points on N Taken up as nitrate (NO3-) or ammonium (NH4+). Little of either in soil at any one time. Concentrations naturally depend on complex, interrelated microbial processes. Deficiency seen as chlorosis. Growth is stunted. N is mobile within the plant, therefore, when deficiency exists N is translocated from older tissue to younger tissue so chlorosis seen on older tissue.
Ammonia or ammonium is oxidized to nitrate fairly quickly by a microbial process called nitrification. This negatively charged ion is not retained by adsorption on soil particle surfaces (since they are negatively charged), so it will be leached if not taken up. Can use a chemical inhibitor to stop nitrification. Nitrification produces H+, so ammonia / ammonium fertilizers are acid-forming. Besides likely to leach, if the soil is anaerobic, the nitrate is converted to nitrous oxide or nitrogen gas and lost from the soil in these forms. This is also a microbial process (called denitrication). Nitrate fertilizers are used with rice (True / False). A very important process involving N is biological N fixation, in which atmospheric N is converted into organic N by certain soil microbes, particularly types living symbiotically with certain plants (including legumes). The plants are called N-fixing plants but it is the microbes that do it.
If the soil does not have the right bacteria, you need to use seed innoculated with them.
Some Points on P Soils are naturally very low in P, the solubility of P in the soil is low and there is little atmospheric deposition of P. Therefore, P is limiting to plant growth. Taken up as the phosphate ions, H2PO4- and HPO42-. Deficiency symptom is purplish color Growth is stunted. Reasons why phosphate is not soluble: Reacts with Al and Fe in acid soils to form insoluble minerals Bonds to the surface of soil mineral particles Reacts with Ca in alkaline soils to form insoluble minerals Solubility of P is greatest in the pH range of 5.5 – 7.0. Without fertilizer input, natural systems are very efficient in cycling P –mineralize organic P to phosphate.
Some Points on K Take up as K+. Very abundant in soils but plants take up a lot of it and although abundant, most K is in the structure of soil minerals (unavailable). K+ adsorbed on negatively charged particles is the main reservoir but it is depleted. Deficiency symptom is chlorosis and necrosis about leaf margins. Plants have a tendency to take up more K than they need for normal growth and development. Called luxury consumption. Accelerates depletion.
K is known for luxury consumption but it happens with most nutrients.
Some Points on S Taken up as sulfate, SO42-. Deficiency seen as chlorosis but, different from N, sulfur is relatively immobile so chlorosis is seen on younger tissue. Growth is stunted. Reasonably abundant in soils but can be depleted. There is atmospheric deposition of S as an input. Some added as an impurity in P fertilizers. Like N and P, S exists in a cycle involving organic S. Depending on the form of organically-bound S and whether the soil is aerobic or anaerobic, the S that is mineralized in organic matter decomposition will be either SO42- or S2-. The latter is toxic.
Some Points on Micronutrients Macronutrients C H O N P K S Ca Mg Micronutrients B Cl Co Cu Fe Mo Mn Ni Zn Micros are essential, only called micro because they are needed in much smaller amounts. Weathering of soil minerals, nutrient cycling and deposition usually adequate to supply micronutrients. However, deficiencies can occur where biomass removal is high, high analysis (i.e., low impurities) fertilizers are used, and on soils with few weatherable minerals (sands and organic soils). High pH can also produce deficiencies because it greatly reduces the solubility of micronutrients except Cl and Mo. High pH favors Mo solubility and availability. primary nutrients, the others secondary in terms of how much is typically added
Mn deficiency cotton The opposite situation can also occur –toxicity. This may occur from unmindful over-application as with biosolids or arise from soil conditions. Low pH increases the solubility of most of the micronutrients. Under anaerobic + acid conditions, Fe and Mn solubilities are especially high.
Crinkle-leaf in cotton due to Mn toxicity. Soil likely too acidic and wet? What to do? Soil testing and plant analysis would provide key information.
Soil Testing and Plant Analysis Unbiased soil sampling is essential. Must take steps to account for variability. Divide field into homogeneous areas Take many random samples, combine, mix and take subsample Avoid atypical areas. Lab analyses Based on soil test levels that are calibrated to field tests. Best to use lab in state because types of tests and field data are appropriate for local soil and environmental conditions.
Plant analysis is based on the relationship between concentration of elements in tissue and growth. 90 % max Also known as hidden hunger. Plants not so deficient as to show symptoms, only stunted. Can’t see this because all plants around are equally stunted.
Salinity and Sodium Problems Lab analyses can indicate or confirm problems to too high salt and Na. Salinity may be directly toxic but indirectly a serious problem because high salts reduce the capacity of plants to uptake water. Plants take up water because the water potential (energy status of water) in roots is less than the water potential in the soil. Salts in the soil solution reduce the water potential in the soil, causing drought stress when the water content of the soil is relatively high. This problem is more common in arid regions, however can occur anywhere irrigation is used and drainage is inadequate.
Drainage is important because it allows salts to leach below the root zone. Avoid irrigation induced salinity by applying a bit more water than the crop needs to force salt leaching. Called leaching requirement. To reclaim saline soil, improve drainage and leach salts. High Na is a more difficult problem. High Na leads to very high soil pH and very poor hydraulic conductivity. The latter means you can’t fix the problem by leaching excess Na. To remediate a sodic soil, add gypsum, CaSO4. It works in a two-fold way: The Ca2+ will form calcite, CaCO3, which will lower the pH to the equilibrium Value set by calcite solubility, about 8.4, high but much better. Second, whereas Na+ is a dispersing cation (tends to break up soil aggregates and clog pores, reducing conductivity), Ca2+ does the opposite. So, gypsum restores freer water flow so that the excess Na can be leached.
How do lab analysis show salinity and sodium problems? Salts are indicated by the electrical conductivity (EC) of a saturated soil paste. A soil is saline if the EC > 4 dS / m Sodium problem is indicated if the concentration of Na, relative to Ca + Mg, in a water extract of soil is above a certain threshold. This parameter is called the sodium adsorption ratio, SAR. A soil is sodic if the SAR > 13. There can be situations when the soil is saline and sodic, saline-sodic. Remediation of saline-sodic soils is the same as for sodic soils, gypsum.
Comments on Soil Water There is a relationship between soil water potential and soil water content. This is called the soil moisture characteristic curve. It is soil-specific. This is the general shape. As the water potential decreases (left to right in figure) water content decreases. This occurs because as a soil drains or dries, the water it contains is held ever more tightly by soil solids –the tension in the water greatly increases.
This water is held at too great tension for plants to extract it from the soil. Field Capacity This water drains so quickly from the root zone that little is available for plant use.
Factors affecting plant-available water Texture Organic Matter Which soil is more droughty, a silt loam with high organic matter or a sand with low organic matter?
Field hydrologic cycle Want to conserve water by: Increasing infiltration / reducing runoff Reduce evaporation Reduce transpiration of competing weeds But have adequate surface and internal drainage so aeration is good in root zone. Surface drainage is a matter of smoothing, grading and making channels. Subsurface drainage is through a network of parallel buried pipe.
Non-point Source Water Pollution from Agriculture Growing issue with potential regulation of operations. Main effect is on downstream water quality, particularly suspended solids and nutrients (N, P and C), that affect levels of dissolved oxygen and / or change the ecology of the water bodies. Suspended solids is largely a matter of soil erosion and its control. N and P lost in surface runoff or internal drainage to some outlet enrich downstream water (eutrophy), leading the ecological changes, including reduced oxygen. Gulf of Mexico hypoxia is thought to be caused by N and P. A problem with using animal waste as a fertilizer is that the nutrient content is not optimal. In particular, if you base the rate of application on N content, then much more P is added than can be used by the crop so soil P builds-up with repeated applications, increasing the likelihood of loss to surface waters. Numerous best management practices (BMPs) can be used to reduce soil erosion and nutrient losses.
Buffer or filter strips trap suspended solids and reduce nutrient losses. Cover crops reduce runoff and conserve nutrients or reduce fertilizer needed. Conservation tillage leaves the soil protected with residue. Less erosion, greater infiltration and build-up of organic matter in surface soil.
Water and Wind Erosion and Their Control The two are conceptually similar. They involve detachment and movement of surface soil by fluids. Consequently, the factors affecting them are similar. Factor Water Erosion Wind Erosion Climate Heavy rainstorms Dry and windy Soil Fine-sandy to silty Fine-sandy to silty most erodible most erodible Topography More erosion on More erosion on smooth, long, steep grades wide-open areas Plant cover Good cover protects Good cover protects soil and limits erosion soil and limits erosion Control practice Contour rows, strip- Rough-up surface, wind- cropping, terracing breaks
Soil Survey Spatial map of soil types in county with chemical and physical data for each and interpretation of their relative suitability for different uses. Available in hardcopy, CD and web forms (Web Soil Survey). Soil types referred to as mapping units. Locate soil type at a site by using index map to find correct areal photo map sheet, then go from there based on landmarks or legal description. Physical and chemical data are given for each horizon. Particularly relevant table is land capability classification (classes I to VIII). Class Severity of Limitation I None. Can be intensively farmed. II Minor. Major limitation given as lower case letter, i.e., e = erodible, w = wet V Major. Only perennial vegetation, i.e., pasture OK VIII Severe. Only recreation.
Soil Morphology and Classification There are 5 master horizons (vertical zones) in soils. Some soils have all, some have only 2. Except for the lowermost horizon, these developed as the soil aged in place. O = organic material above mineral soil A = upper mineral, enriched in organic matter E = little organic material or clay (or salts) B = clay (or salts) accumulated from above C = close to presumed original geologic material Besides master horizons, there are numerous secondary horizon designations and transitional horizon designations, e.g., Ap = plowed, Bt = clay
Classification US system is called Soil Taxonomy. It is analogous to biological classification System, including soil order (parallel to phylum) as the most general level, and series (parallel to species) as the most specific. The simplest of the 12 soil orders is the Entisol. It only has A and C horizons. Thought to be young. The order Alfisol is common in soils formed under forest. It shows A, E, Bt and C horizons and is considered to have been developing in place for a long time.
Mollisols are prairie This is an Oxisol from Similar to the Oxisol is this soils with typically the humid tropics. The Ultisol from Louisiana. These high organic matter. red color is from oxidized forest soils are less highly Prized agricultural iron. These are highly weathered and more fertile soils. weathered, infertile soils. than Oxisols.