Download
1 / 6
60 likes | 230 Vues
Seasonal Variations in the Mixing Layer in the UTLS. GEOS-Chem (GEOS4 v8-01-01) 4° latitude by 5° longitude, 30 vertical levels (top level ~0.01hPa) Linearized ozone (LINOZ) chemistry in stratosphere Global Modeling Initiative (GMI Combo)

E N D
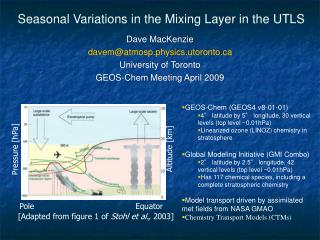
Seasonal Variations in the Mixing Layer in the UTLS • GEOS-Chem (GEOS4 v8-01-01) • 4° latitude by 5° longitude, 30 vertical levels (top level ~0.01hPa) • Linearized ozone (LINOZ) chemistry in stratosphere • Global Modeling Initiative (GMI Combo) • 2° latitude by 2.5° longitude, 42 vertical levels (top level ~0.01hPa) • Has 117 chemical species, including a complete stratospheric chemistry • Model transport driven by assimilated met fields from NASA GMAO • Chemistry Transport Models (CTMs) Dave MacKenzie davem@atmosp.physics.utoronto.ca University of Toronto GEOS-Chem Meeting April 2009 Altitude [km] Pressure [hPa] Pole Equator [Adapted from figure 1 of Stohl et al., 2003]
Background: CO/O3 Correlation • High CO (flat) indicates tropospheric air; high O3 (steep) is stratospheric • Points in between indicate a region of mixing • Distribution of mixing data with altitude relative to tropopause gives mixing layer width and central position • Figures from Hoor et al., 2002 (top) and Pan et al., 2004 (bottom) Number of Data O3 [ppbv] Number of Data CO Mixing Ratio [ppbv] Altitude - TP Height [km]
Improvement with New TPCORE • GEOS-Chem (GEOS4 v7-02-04) had excessive scatter in CO/O3 correlations which was greatly reduced with new TPCORE • New TPCORE increased agreement between GEOS-Chem and GMI • Mixing layer width decreased from ~7.5 km to ~6.5 km (~5 km in GMI) Northern Hemisphere Jan 2006 Northern Hemisphere Mixing Width Jan – May 2006 GEOS-Chem old TPCORE GEOS-Chem new TPCORE GMI GEOS-Chem old TPCORE GEOS-Chem new TPCORE GMI Mixing Layer Width [km] O3 [ppbv] CO [ppbv] Time [months]
CO/O3 Correlations at Three NH Locations • Both models agree on shape and central position of mixing data distribution • Mixing layer center ~0-1km below tropopause in Jun Tropospheric air (O3 ~ 150 ppb) Stratospheric air (CO ~ 30 ppb) North Am Jun 2006 Europe Jun 2006 Asia Jun 2006 GEOS-Chem GMI GEOS-Chem GMI GEOS-Chem GMI • Scatter varies across longitudes Mixed layer O3 [ppbv] O3 [ppbv] O3 [ppbv] CO [ppbv] CO [ppbv] CO [ppbv] North Am Jun 2006 Europe Jun 2006 Asia Jun 2006 GEOS-Chem GMI GEOS-Chem GMI GEOS-Chem GMI Number of Data Number of Data Number of Data Altitude - Tpause [km] Altitude - Tpause [km] Altitude - Tpause [km]
Time Series of Mixing Layer Widths and Centers 5 km width North America 2004 - 2006 Europe 2004 - 2006 Asia 2004 - 2006 GEOS-Chem GMI GEOS-Chem GMI GEOS-Chem GMI • Longitudinal differences in mixing layer width; lots of monthly variability • Seasonal max in winter and min in summer, centered ~0-1km below tropopause • Only major discrepancy between models over Asia Mixing Width [km] Mixing Width [km] Mixing Width [km] Time [months] Time [months] Time [months] North America 2004 - 2006 Europe 2004 - 2006 Asia 2004 - 2006 GEOS-Chem GMI GEOS-Chem GMI GEOS-Chem GMI Tropopause Mixing Center [km] Mixing Center [km] Mixing Center [km] Time [months] Time [months] Time [months]
Summary and Future Work • Summary • New TPCORE improves CO/O3 correlations • There is good agreement between GEOS-Chem and GMI COMBO model, except over Asia where GEOS-Chem produces larger mixing depths • Over North America and Europe the mixing layer depth varies seasonally, whereas the center of the mixing layer does not; over Asia both the mixing layer depth and layer center show strong seasonal variations, which could be linked to the Asian monsoon • Larger mixing width in winter than summer • Mixing layer centered at ~0-1km below the tropopause • Future Work • Apply other techniques and compare to observations (satellites/aircraft) • Compare CTM results to GCM (CMAM) to evaluate influence of assimilation • Determine the relative influence of mixing processes on the mixing layer