Download
1 / 9
90 likes | 186 Vues
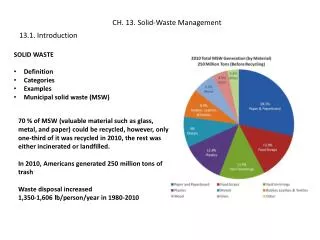
Municipal Solid Waste (MSW) Characterization Data for the United States. 2008. Municipal Solid Waste Generation in 2008 250 Million Tons. Food Scraps 12.7%. Yard Trimmings 13.2 %. Other 3.3%. Wood 6.6%. Rubber, leather, and textiles 7.9%. Paper 31.0%. Plastics 12.0%. Metals 8.4%.

E N D
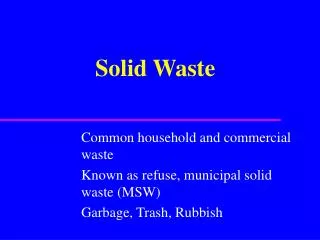
Municipal Solid Waste (MSW) Characterization Data forthe United States 2008
Municipal Solid Waste Generation in 2008 250 Million Tons Food Scraps 12.7% Yard Trimmings 13.2 % Other 3.3% Wood 6.6% Rubber, leather, and textiles 7.9% Paper 31.0% Plastics 12.0% Metals 8.4% Glass 4.9% EPA 2008 Facts and Figures
Products Generated in MSW, 2008 Containers & Packaging 30.8% Food Scraps 12.7% Yard Trimmings 13.2% Nondurable Goods 23.5% Other Wastes 1.5% Durable Goods 18.3% 250 million tons before recycling
Commodity Recycling Trends Neg. = less than 5,000 tons or 0.05 percent.
How Waste is Managed • Land Disposal 54.2% • Combustion 12.6% • Recovery 33.2% MSW Management in the U.S. Recovery 33.2% Combustion 12.6% Land Disposal 54.2%
For more information Please contact: Hope Pillsbury U.S. EPA Office of Resource Conservation and Recovery Pillsbury.Hope@epa.gov (703) 308-7258