Demographic Data
Explore key indicators like HDI, GDP, literacy rate, and life expectancy to differentiate between developing and developed nations. Learn how population pyramids reflect growth rates.

Demographic Data
E N D
Presentation Transcript
Demographic Data Cause and Effect
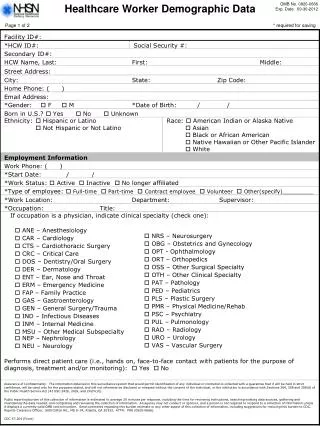
Hook- Make two assumptions about this student based on their progress report. Record your response in your spiral
Again, make two assumptions about this student based on their progress report. Record your response in your spiral.
Hook- Discussion • Will these students be 10th graders next year?? Why or why not? Use evidence from the two progress reports to support your answers.
LINE: Lets review • Open to pg. 293 in the Orange Jarrett book • Lets read/review together • We will discuss each reading as a class and create definitions for these terms as a class on your Demographic Data Notes handout.
Part 1: Economic Developmentpg. 293 • Developed Nations- term used to describe countries with a high standard of living or HDI based on a number of criteria. • Less Developed Nations: term used to describe countries with a low standard of living or HDI based on a number of criteria. • Developing Country-moving from less to more developed economies
Part 2:IndicatorsNow read “Indicators of Development” - pg. 293 • HDI- Human development Index- measures a country’s standard of living in three basic aspects of human development: life expectancy,adult literacy rate and the GDP per capita. • Can take value between 0 and 1. • 0.800 (High) • 0.500 - 0.800 (Medium) • Below 0.500 (Low)
World map indicating the Human Development Index (based on 2010 data, published on November 4, 2010)
Part 2:Demographic IndicatorsContinue reading “Demographic Indicators” - pg. 293 • Life expectancy- the number of years a person is expected to live. • Birth rate-The number of births in a given time and place. • Death rate- The number of deaths per 1000, of the population in a given place and time.
Part 2:Demographic IndicatorsContinue reading “Demographic Indicators” - pg. 293 • Infant mortality- The number children ages 0- 1 dying divided by the number of live births that year.
Part 3: Economic Indicators-Continue reading “Economic Indicators” - pg. 293 • GDP- Gross Domestic Product, the total value of all goods and services produced within a country over a certain period of time. • GDP per capita- the average amount of money earned by each person in country.
Part 4: Social Indicators- • Literacy rate- The percentage of the population aged 10 years and over, who are able to read and write at least one language.
Part 5:Population Density • What is that?????? • Read pages : 162- 163 • A B • Which has picture has a dense population?
Africa's Population Density The Deeper the color, means more people Live there.
On your Notes: create a DOT population map for the 3 areas circled below . Remeber more dots means more people
Part 6: Population Pyramids: Read page- 165 Population pyramid- Graphs showing the distribution of a population by sex, age, ect.
Part 6: Population PyramidsRead page- 165- 166 • Now lets use what you know about Demographic indicators and apply it to population pyramids! • Record the information on the next two slide on part 6 of your notes. • Decide if you are looking at a Developed or Developing Nations! ( you may want to look back at part 1 & 2 of your notes for help)
Indicators of… Low HDI LOW GDP Non -industrialized LOW Literacy rate SHORT Life Expectancy Developing Countries
Certain indicators should be LOW • Literacy rate • Life expectancy • GDP • GDP per capita
Certain Indicators should remain HIGH • Infant mortality rate Birth Rate Death Rate
Indicators of… High HDI High GDP Industrialized High Literacy rate LONG Life Expectancy Developed Countries
Certain indicators should be HIGH • Literacy rate • Life expectancy • GDP • GDP per capita
Certain Indicators should remain LOW or STABLE. • Infant mortality rate Birth Rate Death Rate
We can use this information in a number of ways to make predictions about a place and it’s people. For example…
Which type of country is this? Developed or Developing?? Country XYZ
Characteristics of… Low HDI LOW GDP Non -industrialized LOW Literacy rate SHORT Life Expectancy Developing Countries
What can you tell about this country? Country ABC
High HDI High GDP Industrialized High Literacy rate LONG Life Expectancy Developed Countries
How about this one? • This pyramid of the Philippines shows a triangle-shaped pyramid and reflects a high growth rate of about 2.1 percent annually.
And this one? • The population is growing at a rate of about 1.7 percent annually. • This growth rate is reflected in the more square-like structure of the pyramid. • Note the lump in the pyramid between the ages of about 35 to 50. This large segment of the population is the post-World War II "baby boom." As this population ages and climbs up the pyramid, there will be a much greater demand for medical and other geriatric services.
What does this population pyramid tell us about the USA in 2000?
This one? • Germany is experiencing a period of negative growth (-0.1%). • As negative growth in a country continues, the population is reduced. • A population can shrink due to a low birth rate and a stable death rate. • Increased emigration may also be a contributor to a declining population.
SINKER- Now you try. Looking at the population pyramid, What can you tell about Andorra?