Regression with Autocorrelated Errors
140 likes | 155 Vues
Explore regression modeling of U.S. annual wine consumption and adult population data in a time series context from 1934-2002. Utilize Generalized Least Squares (GLS) with autocorrelated errors for advanced analysis.

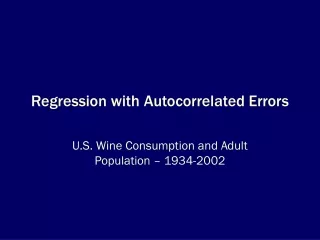
Regression with Autocorrelated Errors
E N D
Presentation Transcript
Regression with Autocorrelated Errors U.S. Wine Consumption and Adult Population – 1934-2002
Data Description • Y=U.S. Annual Wine Consumption (Millions of Gallons) • X=U.S. Adult Population (Millions of People) • Years – 1934-2002 (Post Prohibition) • Model:
SAS Proc Autoreg Output The AUTOREG Procedure Dependent Variable wine Ordinary Least Squares Estimates SSE 158540.525 DFE 67 MSE 2366 Root MSE 48.64439 SBC 738.318203 AIC 733.84999 Regress R-Square 0.9324 Total R-Square 0.9324 Durbin-Watson 0.1199 Standard Approx Variable DF Estimate Error t Value Pr > |t| Intercept 1 -347.9736 21.9895 -15.82 <.0001 adpop 1 4.3092 0.1417 30.40 <.0001 Estimates of Autocorrelations Lag Covariance Correlation -1 9 8 7 6 5 4 3 2 1 0 1 2 3 4 5 6 7 8 9 1 0 2297.7 1.000000 | |********************| 1 2147.9 0.934807 | |******************* |
SAS Proc Autoreg Output Preliminary MSE 289.8 Estimates of Autoregressive Parameters Standard Lag Coefficient Error t Value 1 -0.934807 0.043717 -21.38 Yule-Walker Estimates SSE 18516.1612 DFE 66 MSE 280.54790 Root MSE 16.74956 SBC 596.454422 AIC 589.752103 Regress R-Square 0.5702 Total R-Square 0.9921 Durbin-Watson 1.6728 Standard Approx Variable DF Estimate Error t Value Pr > |t| Intercept 1 -347.2297 74.0420 -4.69 <.0001 adpop 1 4.2540 0.4546 9.36 <.0001