Download
1 / 25
290 likes | 813 Vues
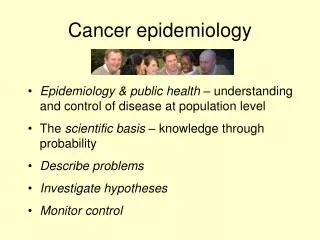
Module 1:. Epidemiology of Oral Cancer. Epidemiology of Cancer, U.S. US Mortality, 2001. No. of deaths. % of all deaths. Rank. Cause of Death. 1. Heart Diseases 700,142 29.0 2. Cancer 553,768 22.9 3. Cerebrovascular diseases 163,538 6.8

E N D
Module 1: Epidemiologyof Oral Cancer
US Mortality, 2001 No. of deaths % of all deaths Rank Cause of Death 1. Heart Diseases 700,142 29.0 2. Cancer 553,768 22.9 3. Cerebrovascular diseases 163,538 6.8 4. Chronic lower respiratory diseases 123,013 5.1 5. Accidents (Unintentional injuries) 101,537 4.2 6. Diabetes mellitus 71,372 3.0 7. Influenza and Pneumonia 62,034 2.6 8. Alzheimer’s disease 53,852 2.2 9. Nephritis 39,480 1.6 10. Septicemia 32,238 1.3 Source: US Mortality Public Use Data Tape 2001, National Center for Health Statistics, Centers for Disease Control and Prevention, 2003.
2004 Estimated US Cancer Cases* Men699,560 Women668,470 Prostate 33% Lung & bronchus 13% Colon & rectum 11% Urinary bladder 6% Melanoma of skin 4% Non-Hodgkin lymphoma 4% Kidney 3% Oral Cavity 3% Leukemia 3% Pancreas 2% All Other Sites 18% 32% Breast 12% Lung & bronchus 11% Colon & rectum 6% Uterine corpus 4% Ovary 4% Non-Hodgkin lymphoma 4% Melanoma of skin 3% Thyroid 2% Pancreas 2% Urinary bladder 20% All Other Sites *Excludes basal and squamous cell skin cancers and in situ carcinomas except urinary bladder. American Cancer Society, 2004.
Lifetime Probability of Developing Cancer, by Site, Men, US, 1998-2000 Site Risk All sites 1 in 2 Prostate 1 in 6 Lung & bronchus 1 in 13 Colon & rectum 1 in 17 Urinary bladder 1 in 29 Non-Hodgkin lymphoma 1 in 48 Melanoma 1 in 55 Kidney 1 in 69 Leukemia 1 in 70 Oral cavity 1 in 72 Source: DevCan: Probability of Developing or Dying of Cancer Software, Version 5.1 Statistical Research and Applications Branch, NCI, 2003. http://srab.cancer.gov/devcan
Lifetime Probability of Developing Cancer, by Site, Women, US, 1998-2000 Site Risk All sites 1 in 3 Breast 1 in 7 Lung & bronchus 1 in 17 Colon & rectum 1 in 18 Uterine corpus 1 in 38 Non-Hodgkin lymphoma 1 in 57 Ovary 1 in 59 Pancreas 1 in 83 Melanoma 1 in 82 Urinary bladder 1 in 91 Uterine cervix 1 in 128 Source:DevCan: Probability of Developing or Dying of Cancer Software, Version 5.1 Statistical Research and Applications Branch, NCI, 2003. http://srab.cancer.gov/devcan
Estimated New Oral Cancer Cases & Deaths by Sex, US, 2004* Estimated New Cases Estimated Deaths Both Sexes Male Female Both Sexes Males Females All sites 1,368,030 699,560 668,470 563,700 290,890 272,810 Oral cavity/pharynx 28,260 18,550 9,710 7,230 4,830 2,400 Tongue 7,320 4,860 2,460 1,700 1,100 600 Mouth 10,080 5,410 4,670 1,890 1,070 820 Pharynx 8,250 6,330 1,920 2,070 1,460 610 Other oral cavity 2,610 1,950 660 1,570 1,200 370
What is oral cancer? • Cancer that starts in the mouth is oral cavity cancer • Includes lips • Inside lining of cheeks (buccal mucosa) • Gingiva (gums) • Floor of the mouth • Anterior 2/3rds of the tongue • Hard palate
Oropharyngeal cancer • Refers to cancers that start in the oropharynx (posterior to the oral cavity) • For convenience, these modules will refer to oral cavity and oropharyngeal cancers as “oral cancer”
Oropharyngeal Cancers:Statistics for the United States • The American Cancer Society estimates 29,370 new cases of oral cavity and oropharyngeal cancer in 2005 • About 7,320 will die from the disease during 2005
Cancer Survival*(%) by Site and Race,1992-1999 African Site White % Difference American All Sites 64 53 11 Breast (female) 88 74 14 Colon & rectum 63 53 10 Leukemia 48 39 9 Non-Hodgkin lymphoma 57 47 10 Oral cavity 60 36 24 Prostate 99 93 6 Urinary bladder 83 64 19 Uterine cervix 73 61 12 *5-year relative survival rates based on cancer patients diagnosed from 1992 to 1999 and followed through 2000.Source: Surveillance, Epidemiology, and End Results Program, 1975-2000, Division of Cancer Control and Population Sciences, National Cancer Institute, 2003.
Incidence rates for oral and pharyngeal cancers (1992-1997) by stage at diagnosis &race/ethnicity The totals in this figure include unstaged cancers. Data source: Surveillance, Epidemiology, and End Results (SEER) 11 Registries Public-Use, August 1999 Submission (1992-1997). The rates are per 100,000 and are age-adjusted to the 1970 U.S. standard population. 13.1.2
Incidence rates for oral and pharyngeal cancers (1992-1997) by stage at diagnosis and gender * The totals in this figure include the unstaged cancers. Data source: Surveillance, Epidemiology, and End Results (SEER) 9 Registries Public-Use, August 1999 Submission (1993-1997). The rates are per 100,000 and are age-adjusted to the 1970 U.S. standard population. 13.1.3
Percentage of adults aged 40 and older who reported having had an oral cancer examination in the past year Data source: 1998 National Health Interview Survey, National Center for Health Statistics, Centers for Disease Control and Prevention. 13.2.1
Oral and pharyngeal cancerdeaths (per 100,000*) in 1998 by race/ethnicity, gender and education * Age adjusted to the year 2000 U.S. standard population. Data source: 1998 National Vital Statistics System, National Center for Health Statistics, Centers for Disease Control and Prevention. 13.3.1
Stage at Diagnosis of Oral Cavity and Oropharyngeal Cancer Incidence Average Annual Percentages for 5-year Time Periods All Races, Both Sexes, Illinois, 1986-2000 Source: Illinois Department of Public Health, Illinois State Cancer Registry, January 2003
Incidence & Mortality, Buccal Cavity and Pharynx, Both Sexes, 1986-2000 State of Illinois Illinois Department of Public Health, Illinois State Cancer Registry, January 2003
State of Illinois Statistics American Cancer Society, 2004
Illinois Statistics American Cancer Society, 2004
Stage at Diagnosis of Oral Cavity and Oropharyngeal Cancer Incidence§ Average Annual Percentages for 5-year Time Periods All Races, Both Sexes, Illinois, 1986-2000 • Figure 11 Oral Cavity and Oropharyngeal Cancer Incidences, 1986-2000 (Site-Race-Ethnicity) • Includes only invasive cancers. Hispanics/non-Hispanics are not mutually exclusive from whites, blacks and • Asian/other races.Source: Illinois Department of Public Health, Illinois State Cancer Registry, January 2003
Oral Cavity and Oropharynx Average Annual Age-adjusted Cancer Rates by Gender and Race/Ethnicity in Illinois, Incidence§ and Mortality, 1996-2000
Percentage Cases Diagnosed at Early Stage Oral Cavity and Oropharyngeal Cancer Incidence§ Illinois Counties, 1986-2000 Figure 14 Oral Cavity and Oropharyngeal Cancer Incidence in Illinois Counties (1986-2000)
Summary • Oropharyngeal cancers are prevalent throughout the U.S. and in the State of Illinois • Men face a greater risk than women, with African American men facing the greatest risk