Download
1 / 76
770 likes | 833 Vues
Explore generational poverty, create mental models, analyze elements, and understand different economic class environments for effective interventions.

E N D
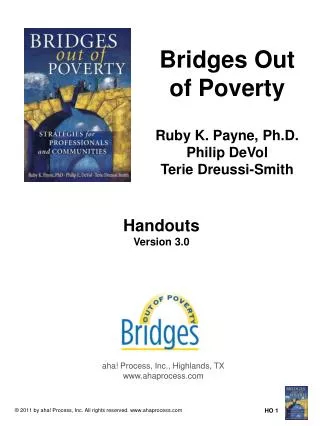
POVERTY: The extent to which an individual does without resources. The Bridges Lens:Definition of Poverty
MODULE ONE MENTAL MODELS OF ECONOMIC CLASS OBJECTIVES • Explore the concrete experience of people in generational poverty. • Create a mental model of poverty. • Analyze elements of the model. • Create a mental model of middle class. • Understand the interlocking nature of the models and the demands of the environment. Individual Lens
Bridges is not a program • Bridges is a “lens” • The lens defines economic class environments • The mental models include poverty, middle class, and wealth • Interventions do not work when models are inaccurate FYI: Use of Accurate Models
At your table build a mental model of POVERTY How is time spent? What organizations are you involved in? How do you recreate? Where do you live? What businesses are near you? What is most important? Learning Exercise
At your table build a mental model of MIDDLE CLASS How is time spent? What organizations are you involved in? How do you recreate? Where do you live? What businesses are near you? What is most important? Learning Exercise
Mental Model for Poverty POLICE SCHOOLS SOCIAL SERVICES RELIGIOUS ORGANIZATIONS Developed by Phil DeVol Businesses • Pawn shop • Liquor store • Corner store • Rent-to-own • Laundromat • Fast food • Check cashing • Temp services • Used car lots • Dollar store
Mental Model for Middle Class POLICE SCHOOLS SOCIAL SERVICES RELIGIOUS ORGANIZATIONS Developed by Phil DeVol Businesses • Shopping/strip malls • Bookstores • Banks • Fitness centers • Veterinary clinics • Office complexes • Coffee shops • Restaurants/bars • Golf courses
Mental Model for Wealth This applies to the wealthiest 1% of households in the United States—those with a net worth of $7.8 million or more. Developed by Ruby Payne
MENTAL MODELS – • Are internal pictures of how the world works • Exist below awareness • Are theories-in-use, often unexamined • Determine how we act • Can help or interfere with learning For a dialogue to occur, we must suspend our mental models. Source: The Fifth Discipline Fieldbook by Peter Senge.
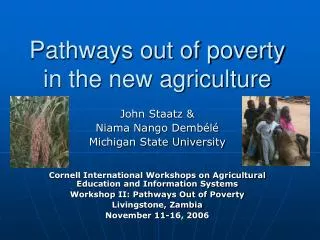
MODULE TWO RESEARCH CONTINUUM OBJECTIVES • Understand the causes of poverty in order to build resources. • Understand what is needed to build a sustainable community. Individual Lens
Poverty – Generational – Situational – (Key Points page 7 #4) Caused By: • Absence of Resources • Political/Economical • Wrong Choices • Exploitation
CAUSES OF POVERTY—RESEARCH CONTINUUM Source: Getting Ahead in a Just-Getting’-By World Workbook Revised Edition by Philip E. DeVol (2013).
What are the housing costs in your community? http://www.areavibes.com/montrose-co/cost-of-living/
Housing Nationally there are only 30 units affordable and available for every 100 extremely low income households. Federal Assistance serves only ¼ of those who qualify. National Low Income Housing Coalition Resource Libray http://nlihc.org/article/affordable-rental-housing-how-it-works 70% of people in poverty spent over 50% of their income on housing Middle Class = Avg 4 in 1 residence “Where are you living?” Implies Stability Dec 29, 2009 – Denver post.com - Childhood Poverty in CO
Colorado Monthly Rent Affordable to Selected Income with Two-Bedroom FMR example In Colorado, the Fair Market Rent (FMR) for a two-bedroom apartment is $916. In order to afford this level of rent and utilities – without paying more than 30% of income on housing – a household must earn $3,052 monthly or $36,623 annually. Assuming a 40-hour work week, 52 weeks per year, this level of income translates into a Housing Wage of: $17.61 In Colorado, a minimum wage worker earns an hourly wage of $8.00. In order to afford the FMR for a two-bedroom apartment, a minimum wage earner must work 88 hours per week, 52 weeks per year. Or a household must include 2.2 minimum wage earners working 40 hours per week year-round in order to make the two-bedroom FMR affordable. In Colorado, the estimated mean (average) wage for a renter is $14.90. In order to afford the FMR for a two-bedroom apartment at this wage, a renter must work 47 hours per week, 52 weeks per year. Or, working 40 hours per week year-round, a household must include 1.2 workers earning the mean renter wage in order to make the two-bedroom Source: http://www.housingcolorado.org/?page=affordablehousingco
What is the Living Wage in your County? Grand Junction Adult - $10.20 minimum - $11.27 livable (?) Adult w/ 1 child - $24.75 Adult w/ 2 children - $28.77 http://livingwage.mit.edu/counties/08077 $11.27 x 40hr = $450.80 x 52 weeks = $23,441.60 30% is $7032.3/12 = $586 affordable rent $16 x 40 = $640 x52 weeks = $33,280 30% is $9984/12 = $832 affordable rent
Research: Income, Race, and Health Learning Exercise Talk to your neighbors about how you have seen the health inequities linked to income and race. How do these inequities show up and impact the quality of work that you are called to do?
Inequities in Health Two Bodies of Research Population Health Disparities Healthcare Disparities
Health Disparities Research Linked to Health Outcomes • Lower economic status • Lower social status associated with racial/ethnic discrimination • Individuals employed in stressful working conditions with low hierarchy and decision-making capacity
Population Health Disparities Health disparities research focuses on how living conditions and environments influence health outcomes for groups with lower hierarchy.
What We Know Source: Based on a study by Shafir, Mani, Mullainathan, and Zhao. Reported by Emily Badger in Urban Work, 8/29/13. www.theatlanticcities.com/jobs-and-economy/2013/08/how-poverty-taxes-brain /6716/ POVERTY TAXES THE BRAIN Emily Badger writes: “Poverty imposes such a massive cognitive load on the poor that they have little bandwidth … a mental burden akin to losing 13 IQ points … Coping not just with a shortfall of money, but also with a concurrent shortfall of cognitive resources.”
Poverty and the Developing Brain: Insights from Neuro-imaging • Brain imaging has contributed to the understanding of economic disparity by identifying changes in the brain’s structure and function associated with poverty. • Due to the plasticity of neural pathways, some of the effects of poverty on the brain may be reversible. Source: Sheeva Azma, Synesis: A Journal of Science, Technology, Ethics, and Policy, 2013; 4: G40-46. Poverty is a significant social problem, affecting how individuals live and the resources available to them. For children, poverty represents a chronically suboptimal developmental environment as much as it reflects a state of economic stress.
What We Know Costs of health and healthcare are increasing annually The majority of baby boomers will be on Medicare by 2020 Health is directly related to education and socioeconomic status Lack of resources reducesindividual, institutional, and community collective efficacy
What We Know POVERTY AND DEATH From Debra Watson: A research team from Columbia University’s Mailman School of Public Health in New York City has estimated that 875,000 deaths in the U.S. in 2000 could be attributed to a cluster of social factors bound up with poverty and income inequality.… According to U.S. government statistics, some 2.45 million Americans died in 2000. Thus, the researcher’s estimate means that social deprivation was responsible for some 36 percent of total U.S. deaths that year, a staggering total. Watson quotes Dr. Galea, chair of Mailman’s Department of Epidemiology, as saying, “If you say that 291,000 deaths are due to poverty and income inequality, then those things matter, too.” These excess deaths represent a huge potential loss of intellectual, financial, and human social capital.
MODULE THREE BRIDGES CONSTRUCTS OBJECTIVE Establish key concepts that underlie Bridges Out of Poverty and aha! Process knowledge. Individual Lens
BRIDGES CONSTRUCTS • Use the lens of economic class to understand and take responsibility for your own societal experience while being open to the experiences of others. • At the intersections of poverty with other social disparities (racial, gender, physical ability, age, etc.), address inequalities in access to resources. • Define poverty as the extent to which a person, institution, or community does without resources. • Build relationships of mutual respect. • Base plans on the premise that people in all classes, sectors, and political persuasions are problem solvers and need to be at the decision making table. Source: Bridges Out of Poverty Training Supplement, p. 25
BRIDGES CONSTRUCTS (continued) Base plans on accurate mental models of poverty, middle class, and wealth. At the individual, institutional, and community/policy levels: Stabilize the environment, remove barriers to transition, and build resources. Address all causes of poverty (four areas of research). Build long-term support for individual, institutional, and community/policy transition. Build economically sustainable communities in which everyone can live well. Source: Bridges Out of Poverty Training Supplement, p. 25
Bridges Constructs Use the lens of economic class to understand and take responsibility for your own societal experience while being open to the experiences of others. Address inequalities in access to resources at the intersection of poverty with other social disparities (racial, gender, physical disability, etc.). Define poverty as the extent to which a person, institution, or community does without resources. Build relationships of mutual respect. Base plans on the premise that people in all classes, sectors, and political persuasions are problem solvers and need to be at the decision-making table.
Bridges Constructs (continued) Base plans on accurate mental models of poverty, middle class, and wealth. Stabilize the environment, remove barriers to transition, and build resources at the individual, institutional, and community/policy levels. Address all causes of poverty (four areas of research).Note: BTHH uses six areas of research. Build long-term support for individual, institutional, and community/policy transition. Build sustainable communities in which everyone can live well.
MODULE FOUR HIDDEN RULES OBJECTIVE Understand and give examples of the hidden rules of the three economic class environments. Individual Lens
Situated-learning environments Are unspoken cues and habit of a group—are learned collectively Become deep rooted expectations Can be learned in new environments too Are critical to transitioning along the continuum from poverty to wealth Impact relationships (social capital) Impact health behaviors Hidden Rules
WHAT CAN YOU DO IN THE WORK AND AGENCY SETTING? Hidden Rules • Understand the hidden rules of your work/agency setting. • Understand the hidden rules that customers and employees bring with them. • Ensure that programs are not based on one set of hidden rules. Institutional Lens
Review Health & Health Care Checklists Page 52 BTHH
PBS Special PEOPLE LIKE US Tammy Crabbtree - Matt Heid Waverly, Ohio • Do you see: • Hidden Rules • Language • Family Structure • Resources • Future Story • Support for Transistion • 2. What tools could you use to help? http://www.youtube.com/watch?v=Q8VXrHeLqBA
MODULE FIVE LANGUAGE OBJECTIVES • Distinguish the different registers of language and assist people in the development of the formal register. • Understand how language register, story structure, and language experience influence cognitive development. Individual Lens
REGISTERS OF LANGUAGE Adapted from work of Martin Joos
There is disparity in patient care between lower hierarchy groups and greater hierarchy groups • Disparity is not necessarily associated with insurance or access • Disparities are more likely associated with human interactions in healthcare settings What the Data Show
How a patient is perceived—the perceptual lens of the clinic staff and the healthcare institution—influences the treatment the patient experiences. How the patient perceives the staff is equally powerful. Human Interactions
“If the mother appears to be at least middle-class and is—it is assumed that “something happened” and that the mother had completed appropriate perinatal preventive treatment, did not smoke, drink, use drugs, or make other poor decisions that compromised the pregnancy. … There was a different discussion about the mother who appears to be from poverty. There was likely to be less generosity in assigning good choices to the mother and family. Staff tended to assume that this mother smoked or drank during the pregnancy.” Point of View in NICU —Excerpts from an interview with a prominent healthcare provider