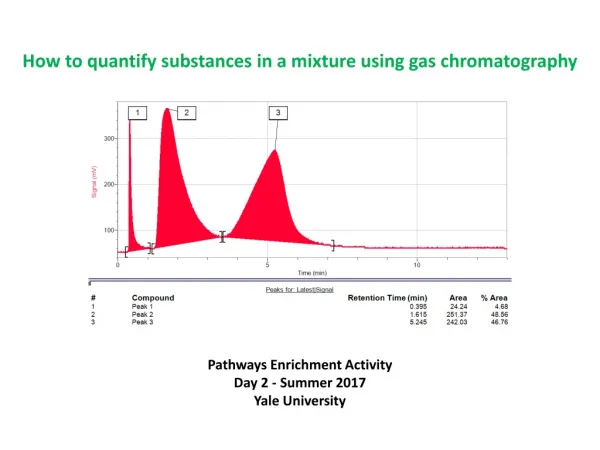
How to quantify substances in a mixture using gas chromatography
How to quantify substances in a mixture using gas chromatography. Pathways Enrichment Activity Day 2 - Summer 2017 Yale University. Why is it useful to quantify the substances in a mixture?. Real-world example: Food quality analysis.

How to quantify substances in a mixture using gas chromatography
E N D
Presentation Transcript
How to quantify substances in a mixture using gas chromatography Pathways Enrichment Activity Day 2 - Summer 2017 Yale University
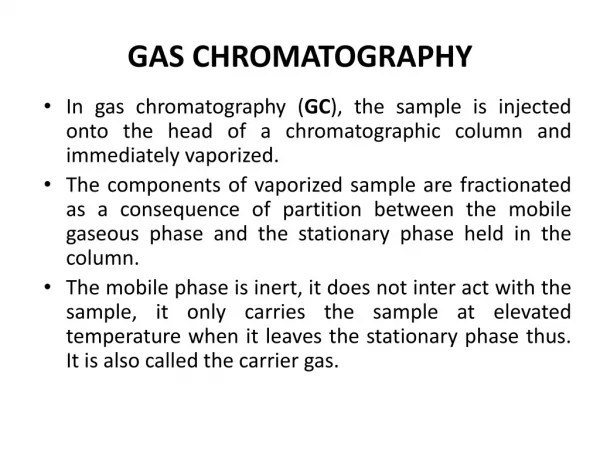
Real-world example: Food quality analysis The use of pesticides is very important to optimize crop yields, which lowers food prices and increases food availability worldwide In general, pesticides are harmful to the body and should not be ingested, so it is important to make sure that they aren’t absorbed by the crop and are washed off Gas chromatography is a very accurate way to determine the identity (retention time) and quantity of any pesticides that might be present inside or on a crop What it might look like if a crop hasn’t been washed yet: Sample Crops must pass regulations that guarantee that they do not contain harmful amounts of a pesticide, so it is important that they are carefully analyzed!
Real-world example: Blood alcohol content Every country in the world has laws that limit the amount of alcohol a person can consume before operating heavy machinery or a motor vehicle Breaking this law has serious consequencesbecause of the danger involved with operating machinery/vehicles under the influence of alcohol Because of this, very accurate analytical methods need to be available for law enforcement to assess whether the law has been broken or not: Most accurate method: measuring the amount of alcohol in the blood using gas chromatography ethanol peaks Forensic scientists obtain a sample of blood from a person, and analyze it with a precise GC instrument to quantify the amount of ethanol (alcohol) in a particular volume of blood Notice how well-separated the peaks are! Their instruments are better than ours.
Real-world example: Developing “green” energy technologies Currently, the world is dependent on burning fossil fuel for energy, which contributes to greenhouse gases and is a leading cause of global climate change. Cutting-edge research is focused on converting carbon dioxide (CO2) in the atmosphere into chemicals that we can use as fuel instead. catalyst This entails designing new catalysts that can do these very difficult reactions. Real data from a study from the Wang group at Yale published in 2016 Scientists use gas chromatographyto analyze how efficient and successful these catalysts are. Gas chromatography can tell scientists whether the desired products are formed from the reaction and how efficiently they are formed.
How can we quantify a substance using gas chromatography? Let’s think about what data we obtain from a gas chromatogram.
How can we quantify a substance using gas chromatography? Let’s think about what data we obtain from a gas chromatogram. The retention timecan tell us what a compound is, but not how much of it there is.
How can we quantify a substance using gas chromatography? Let’s think about what data we obtain from a gas chromatogram. The peak areaof a substance is directly proportional to the amount of that substance that is detected in the sample. But this number only represents the detector response factor!
How can we quantify a substance using gas chromatography? Let’s think about what data we obtain from a gas chromatogram. Very important: The detector response factorcan change depending on the analyte, the detector used, the experimental method used, and other factors. This means the % Area column is not helpful.
How can we quantify a substance using gas chromatography? Let’s think about what data we obtain from a gas chromatogram. The detector response factorcan change depending on the analyte, the detector used, the experimental method used, and other factors. How can we correlate this to an analyte’s actual concentration in the mixture?
We can use the internal standard method If we independently add a known amountof a third substance (an internal standard), we can compare the peak area of our analyte to the peak area of our internal standard. internal standard Now we have three peaks in the chromatogram, but we know that the first peak is our internal standard that we purposefully added. Since we know the exact concentration of the internal standard (by adding a known amount), we know that its peak area corresponds to that particular concentration.
We can use the internal standard method If we independently add a known amountof a third substance (an internal standard), we can compare the peak area of our analyte to the peak area of our internal standard. internal standard Now we have three peaks in the chromatogram, but we know that the first peak is our internal standard that we purposefully added. We can also compare the areas of other peaks to the internal standard peak to get a peak area ratio.
Linking the peak area ratio with the amount of an analyte What do we do with this information? We need to determine what the peak area ratio means by figuring out the relative response of an analyte to the internal standard The relative response is how the peak area ratio of an analyte peak changes when the concentration of the analyte changes (keeping the internal standard concentration the same):
Linking the peak area ratio with the amount of an analyte What do we do with this information? We need to determine what the peak area ratio means by figuring out the relative response of an analyte to the internal standard The relative response is how the peak area ratio of an analyte peak changes when the concentration of the analyte changes (keeping the internal standard concentration the same): How do we determine this? We have to run an experiment! If we make several test mixtures that contain the analyte at various concentrations while keeping the internal standard concentration constant, we can compare the peak area ratios of the peaks in each mixture and see how they change when the concentration of the analyte changes. For example: Let’s figure out the relative response of an analyte to an internal standard. We would make 5 separate mixtures containing the same concentration of internal standard, but we would change the concentration of analyte in each mixture.
Let’s see what this looks like in practice: Notice how the relative sizeof the second peak (analyte) increases compared to the first peak (internal standard) peak area ratio
Let’s see what this looks like in practice: We can calculate the peak area ratio by dividing the area of the substance that we want to quantify by the area of the internal standard: peak area ratio
Let’s see what this looks like in practice: Peak area ratio: Peak area ratio: Peak area ratio: Peak area ratio: We can calculate the peak area ratio by dividing the area of the substance that we want to quantify by the area of the internal standard: Peak area ratio: peak area ratio
Let’s see what this looks like in practice: Peak area ratio: Peak area ratio: Peak area ratio: Peak area ratio: Notice that the peak area ratio and percentage of the analyte are both increasing! Peak area ratio: peak area ratio
Constructing a calibration curve Since the peak area ratio of the analyte to the internal standard increases with the percentage of the analyte in the mixture, we can determine their linear relationship yis the dependent variable (peak area ratio of analyte to internal standard peak) xis the independent variable (percentageof analyte in the mixture) mis the slope (change in peak area ratio with increase in percentage of analyte) bis the x-intercept, which usually is attributed to background signal
Constructing a calibration curve Since the peak area ratio of the analyte to the internal standard increases with the percentage of the analyte in the mixture, we can determine their linear relationship yis the dependent variable (peak area ratio of analyte to internal standard peak) xis the independent variable (percentageof analyte in the mixture) mis the slope (change in peak area ratio with increase in percentage of analyte) bis the x-intercept, which usually is attributed to background signal We know five different peak area ratios based on five different percentages of analyte, which means we know five different sets of x- and y-coordinates We can now calculate their linear relationship to make a calibration curve.
Constructing a calibration curve yis the dependent variable (peak area ratio of analyte to internal standard peak) xis the independent variable (percentageof analyte in the mixture)
Constructing a calibration curve yis the dependent variable (peak area ratio of analyte to internal standard peak) xis the independent variable (percentageof analyte in the mixture) Peak Area Ratio
Constructing a calibration curve yis the dependent variable (peak area ratio of analyte to internal standard peak) xis the independent variable (percentageof analyte in the mixture) Peak Area Ratio Now every time we know the peak area ratio of the analyte peak to the internal standard peak, we can calculate the percentage based on the linear equation! The linear equation is called the calibration curve.
Constructing a calibration curve yis the dependent variable (peak area ratio of analyte to internal standard peak) xis the independent variable (percentageof analyte in the mixture) Peak Area Ratio Note: A separate calibration curve has to be constructed for eachanalyte that you want to quantify in a mixture, and a new calibration curve must be constructed every time you change the instrument, the internal standard, or the experiment method…
Today’s experiment Today you will make a hypothesis on both the identity and amounts of each substance in Mixture B and test your hypothesis using the gas chromatographs “Blueberry oil” “Banana oil” “Cough syrup oil” How will you determine the identity of each substance in the mixture?
Today’s experiment Today you will make a hypothesis on both the identity and amounts of each substance in Mixture B and test your hypothesis using the gas chromatographs “Blueberry oil” “Banana oil” “Cough syrup oil” How will you determine the identity of each substance in the mixture? smelling the mixture and looking at the retention times in the chromatogram
Today’s experiment Today you will make a hypothesis on both the identity and amounts of each substance in Mixture B and test your hypothesis using the gas chromatographs “Blueberry oil” “Banana oil” “Cough syrup oil” How will you determine the identity of each substance in the mixture? smelling the mixture and looking at the retention times in the chromatogram How will you determine the quantity of each substance in the mixture?
Today’s experiment Today you will make a hypothesis on both the identity and amounts of each substance in Mixture B and test your hypothesis using the gas chromatographs “Blueberry oil” “Banana oil” “Cough syrup oil” How will you determine the identity of each substance in the mixture? smelling the mixture and looking at the retention times in the chromatogram How will you determine the quantity of each substance in the mixture? Using a calibration curve! We will add a known amount of an internal standard and calculate the percentage of an analyte from its peak area ratio to the internal standard.
Important notes for today’s experiment: We will use ethyl acetate as an internal standard, but we have to add it as a precise known quantity. We will help you do this using a micropipet – don’t do this step on your own! We have already constructed the calibration curves for this experiment, and you can find them on your reference page. Make sure you are using the right equation for your particular GC. When smelling a chemical, never stick your nose into it. Use your hand to waft the vapors towards you instead. Please keep the mixtures capped when you aren’t using them so the whole room doesn’t smell like blueberries and bananas. Make sure you press “collect” and inject the sample at the same time, then immediately remove the syringe from the gas chromatograph. If you have any questions or aren’t sure about a step in the instructions – please ask!