Economics Workshop Strategy Unit
Join the workshop to gain a practical understanding of economics, from microeconomics to macroeconomics, along with economic models and market dynamics. Learn to analyze economic data and make informed decisions.

Economics Workshop Strategy Unit
E N D
Presentation Transcript
Economics Workshop Strategy Unit Sandeep Kapur 1-3 February 2006
WORKSHOP OBJECTIVES To provide rigorous but non-mathematical training in economics, enabling participants to • develop a simple but reliable toolkit for economic analysis • practise its application using concrete problems • apply economic theory to their own work
Basic Concepts • MICROECONOMICS: study of decisions made by consumers, producers, and their interaction in specific markets • MACROECONOMICS: the big picture – emphasizes interactions in the economy as a whole
Basic Concepts • POSITIVE ECONOMICStries to explain behaviour • NORMATIVE ECONOMICS prescriptions, usually based on value judgment
The central questions What goods and service to produce? How to produce? (choice of technology) For whom? (income distribution) FREE MARKET ECONOMY what, how & for whom decided by prices, incomes, wealth COMMAND ECONOMY central authority directs use of resources
Degrees of government intervention differ.. Cuba - China - Denmark -UK- USA - Hong Kong
Scale of government Spending as share of national income(%)
The Production Possibility Frontier Maximum quantity one good that can be produced, given quantities of other goods being produced A, B, Cefficient (on the frontier) D, Einefficient (inside the frontier) F, Gunattainable (outside the frontier)
Basic Concepts OPPORTUNITY COST of any good or service Quantity of other goods sacrificed to get one more unit of this good The underlying notion of trade-offs.
Economic Models MODEL Deliberate simplification of reality like a map DATA Time Series Cross-Section Panel Data
Tools: Visualizing data A scatter diagram
Bus Revenue + + + + + + + + + Bus fare Tools: Interpreting the data It appears that higher bus fares lead to higher revenue…
Bus Revenue + + + + + + + + + Bus fare … but it might not be true Suppose the two clusters are from two different time periods – what might that suggest? High tube fare Low tube fare
Tools: Modelling Bus revenue depends on bus fares Revenue = fare x journeys Number of bus journeys depends on bus fares But also on other things • price of other modes of travel (tube fares) • reliability relative to other modes of travel • relative comfort and perception of safety
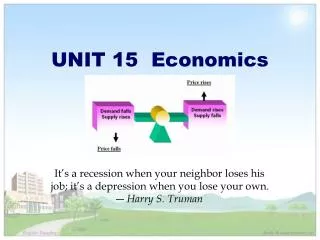
Market • DEMANDquantity buyers wish to buy at each price • SUPPLYquantity producers wish to sell at each price • MARKET any arrangement in which prices adjust to reconcile buyers and sellers intentions • EQUILIBRIUM PRICEthe price at which market clears (i.e. quantity demanded = quantity supplied)
Market Supply curve price Equilibrium Price Demand curve Equilibrium Quantity quantity PRICE ADJUSTMENT Equilibrium price clears market
Price Controls • Suppose government sets minimum price above market clearing price Price Supply curve Controlled price Equilibrium price Demand curve • Examples incl • CAP • Minimum Wages • Rent Control Equilibrium quantity Quantity
DEMAND IN DETAIL elaborating on the ‘other things’ Demand curve shows relation between price of a good and quantity demanded of that good. How does demand change when 1 price of a related good changes? • substitutes vs complements 2 consumer’s income changes? • normal goods vs inferior goods 3 tastes change? • role of fashions and fads, culture
COMPARATIVE STATICS(effect of changing the ‘other things’) Suppose income rises, increasing demand
SUPPLY IN DETAIL elaborating the ‘other things’ How does SUPPLY of a good vary when • technology improves? • input prices change? energy, labour, capital 3 regulation imposes extra costs?
COMPARATIVE STATICS Suppose technical breakthrough raises supply…
COMPARATIVE STATICS An important difference • If demand shifts, equilibrium price and quantity move in the SAME DIRECTION • If supply shifts, equilibrium price and quantity move in OPPOSITE DIRECTIONS
Introduction to EconomicsGROUPWORK 1 Are the following statements positive or normative? (a) Higher tax rates cut revenue from tobacco taxes (b) Poor countries get an unfair share of world income (c) Smoking is antisocial & should be discouraged (d) Airbus needs public support (e) Airbus deserves public support (f ) Airbus is a good investment for Britain
GROUPWORK • The price of crude oil increased from $2.90 to $9 per barrel in 1973, in a coordinated move by OPEC members. (a) How did the OPEC members manage to raise the price? Show using a supply-demand diagram for the oil market. (b) What happened to the demand for coal and the price of coal? Show using a supply-demand diagram for the coal market. (c) What happened to the demand for fuel-guzzling cars? (d) What happened to supply and demand for oil eventually?
GROUPWORK 3 The following data describe price and output of a product: (a) Plot a scatter diagram (b) “Higher prices make firms raise output.” “People buy less when prices are higher” Does the diagram shed any light on these statements? Could both be correct? Explain.
Price Elasticity of Demand % change in the quantity demanded Measures the price sensitivity of demand % change in price • Elastic demand: sensitive to price changes • Inelastic demand: relatively insensitive • Depends ultimately on substitution possibilities
Implications for Revenue Price In demand is elastic, a fall in price raises the quantity demanded by a greater percentage than the price. Thus revenue rises as price falls In demand is inelastic, a fall in price raises the quantity demanded by a smaller percentage than the price. Thus revenue falls as price falls Price Quantity Quantity
Example Brazil coffee exports
Other elasticities Cross price elasticity of demand for good i with respect to changes in price of good j % change in the quantity demanded of good i % change in price of good j • Positive when goods are substitutes • Negative when goods are complements
Other elasticities Income elasticity of demand % change in the quantity demanded % change in real income • Normal good have positive income elasticity of demand • Greater that 1 for luxury goods • Less than 1 for necessities • Inferior good have negative income elasticity
Price Elasticity of Supply Price Elasticity of Supply % change in the quantity supplied % change in price Supply elasticities are usually positive
Theory of Consumer Choice A consumer has preferences over different goods and services Budget constraint describes the different bundles that the consumer can afford given prices and income Consumer makes herself as well off as possible, given the budget constraint
The Effect of Relative Price Changes The effect of price changes • Substitution effect: you buy less of things that have become relatively expensive. • Income effect: the decrease in real income due to price increase may reduce purchases of all goods.
Impact of wage rates on labour supply The two effects may work in oppositive directions… As wage rates increase • workers want to work longer hours because work is relatively more attractive (substitution effect) • workers may want to work less because higher incomes make them want to consume more leisure (income effect) The net effect could go either way
Government Intervention Intervention in free markets is usually motivated by • Equity considerations • Efficiency considerations • Ethical or moral arguments
EQUITY How fair is the distribution of goods and services? Of course, fairness is a value judgement In principle, we can distinguish between • Horizontal equity: equal treatment of equals • Vertical equity: different treatment of different people to reduce effects of inequality
Equity of Allocations Allocation: a description of who gets what Starting from A, a move to E or F reflects a decrease in equity
Efficiency of allocations Relative to initial point A • B is better for all (and C is worse) • D is better for one, and no worse for other B & D are said to be Pareto improvements on A
Economic Efficiency An allocation is Pareto efficient (given tastes, resources and technology) if it is impossible to find another allocation that makes someone better off and nobody worse off. • There can be more than one Pareto efficient allocation, and • even inequitable allocations may be Pareto efficient
Are Markets Pareto Efficient? Key Questions • Do free markets lead to Pareto efficient outcomes? Always? • If sometimes not, why not? • What are the implications for policy?
Competitive Markets In competitive markets • there are many firms, each too small to have any influence on market price (they are ‘price takers’) • competition ensures prices are close to the marginal cost of production (marginal cost measures the opportunity cost of producing another unit of the good) • of course, this assumes no tax or other distortions
Competitive Equilibrium & Pareto Efficiency In undistorted, competitive markets • consumers align their consumption choices to market prices • prices equal the marginal cost of production • so that there is no way to reallocate resources to generate a Pareto improvement • PUNCH LINE: Competitive equilibrium is Pareto efficient (The Invisible Hand Theorem!)
AN IDEA If indeed markets are efficient • rely on markets to achieve efficiency, and • confine government intervention to redistribution However markets may not always be efficient Market Failure: a circumstance in which equilibrium in free markets fails to achieve an efficient allocation