Download
1 / 17
170 likes | 195 Vues
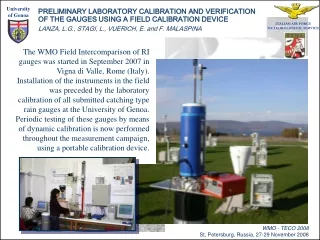
The WMO Field Intercomparison of RI gauges was started in September 2007 in Vigna di Valle, Rome (Italy). Installation of the instruments in the field was preceded by the laboratory calibration of all submitted catching type rain gauges at the University of Genoa.

E N D
The WMO Field Intercomparison of RI gauges was started in September 2007 in Vigna di Valle, Rome (Italy). Installation of the instruments in the field was preceded by the laboratory calibration of all submitted catching type rain gauges at the University of Genoa. Periodic testing of these gauges by means of dynamic calibration is now performed throughout the measurement campaign, using a portable calibration device.
Preliminary tests in the laboratory (see WMO Lab Intercomparison procedure) Laboratory of the University of Genoa
Box-plots indicate the mean (solid line), median (thin line), 25-75th percentiles (box limits), 10-90th percentiles (whisker caps) and outliers (black circles).
Novel approach: tests are performed at one-minute resolution. “Instantaneous” RI rather than long term averages.
Best performing tipping-bucket rain gauge Box-plots indicate the mean (solid line), median (thin line), 25-75th percentiles (box limits), 10-90th percentiles (whisker caps) and outliers (black circles).
Best performing weighing gauge Box-plots indicate the mean (solid line), median (thin line), 25-75th percentiles (box limits), 10-90th percentiles (whisker caps) and outliers (black circles).
Typical (left) and bad (below) tipping-bucket rain gauges Box-plots indicate the mean (solid line), median (thin line), 25-75th percentiles (box limits), 10-90th percentiles (whisker caps) and outliers (black circles).
All catching type rain gauges Range: 0-100 mm·h-1 Range: 100-300 mm·h-1 Note: both axes of the graphs are distorted by a power factor of three.
All tipping-bucket rain gauges Range: 0-100 mm·h-1 Range: 100-300 mm·h-1 Note: both axes of the graphs are distorted by a power factor of three.
Tipping-bucket rain gauges with correction Range: 0-100 mm·h-1 Range: 100-300 mm·h-1 Note: both axes of the graphs are distorted by a power factor of three.
Weighing rain gauges Range: 0-100 mm·h-1 Range: 100-300 mm·h-1 Note: both axes of the graphs are distorted by a power factor of three.
A portable device was developed at the University of Genoa with the aim of providing the on-site capability of performing the same kind of tests that were preliminarily used for calibration of all submitted catching type rain gauges under controlled conditions in the laboratory.
The principle exploited by this portable device is that of preserving a constant hydraulic head over a given orifice area by ensuring the automatic and continuous pressure adaptation of the air/water contained inside a closed container. The transit time of the water level between two fixed limits is the only variable to be measured to complete the test at any reference rainfall intensity. In order to reduce the sampling error, with reference to e.g. a tipping-bucket rain gauge having a resolution of 0,2 mm (bucket volume of 20 g) and a collector’s area of 0,1 m2, the container should be filled in with at least 2 litres of water, so that at least 100 tips of the buckets will occur. Patent n° 102006A000868 dated 07/12/2006
Application in the field test site WMO procedure for field verification …
Conclusions The laboratory phase of the RI Field Intercomparison proved to be very useful in providing basic information on the behaviour of the catching type instruments involved, in order to single out counting errors from the assessment of the overall accuracy of the instruments, with specific reference to their catching errors and uncertainties due to the operating conditions (dynamic performances, wind and atmospheric conditions, etc.). In this view the laboratory calibration tests were performed at the resolution of one minute, so that the spreading of the errors around their average value already investigated during the previous Laboratory Intercomparison could be also evaluated. The development of a portable Field Calibration Device to be used for checking the instruments as installed – with no need to return them to the laboratory where standard calibration tests can be performed – was very effective in keeping the behaviour of the instruments under control throughout the measurement campaign. The operational procedure is that of comparing on a regular basis the calibration data of each instrument at a few calibration points (constant flow rates) with the full calibration curves preliminarily obtained in the laboratory, and this is currently used as a criterion to assess the correct behaviour of that particular instrument.
Future perspectives The calibration in the field using a portable device allows investigating the achievable uncertainty in the field – filling the gap between precise (though far from the real world) laboratory tests and the necessary metrological confirmation in the field. The experience gained at the laboratory of the University of Genoa and at the field site in Vigna di Valle (Rome) were very fruitful and allowed to develop a consistent specific know-how on rainfall intensity measurements and the related instruments. It is important that after completion of this RI intercomparison the acquired know-how and the professional capacities developed are not abandoned. Specific operational structures dedicated to rainfall intensity measurements so as to ensure the quality, continuity, homogeneity and archiving/accessibility of the related information could be easily built upon such capacities. This same structures will exploit the above capacity and technical-scientific know-how as well as operational capacities in verification, calibration, metrological confirmation and performance testing on prototype and commercial instruments.