Average true range - Technical Analysis Indicator
The average true range is a moving average (generally 14-days) of the true ranges.

Average true range - Technical Analysis Indicator
E N D
Presentation Transcript
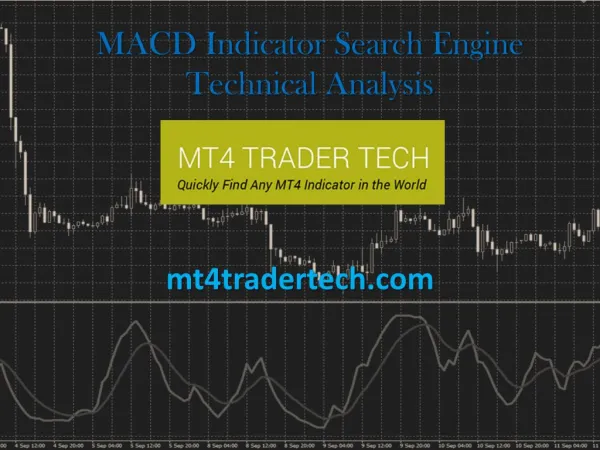
http://www.nsedata.com Technical analysis indicator Average True Range
http://www.nsedata.com ATR was originally developed for commodities but the indicator can also be used for stocks and indexes. The average true range is a moving average (generally 14-days) of the true ranges. Introduction:
http://www.nsedata.com Current ATR = [(Prior ATR x 13) + Current TR] / 14 Formula:
http://www.nsedata.com ATR is not a directional indicator, such as MACD or RSI. Instead, ATR is a unique volatility indicator that reflects the degree of interest or disinterest in a move. ATR can be used to validate the enthusiasm behind a move or breakout. A bullish reversal with an increase in ATR would show strong buying pressure and reinforce the reversal. Advantages: