Download
1 / 39
390 likes | 402 Vues
Learn LabVIEW programming basics in this hands-on guide. Set up hardware, choose devices, create custom VIs, and explore graphical programming for data acquisition.

E N D
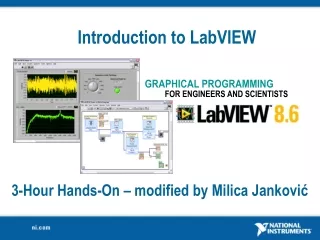
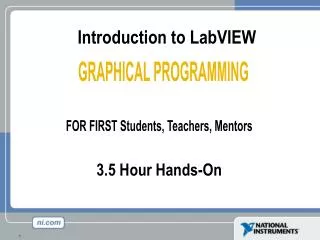
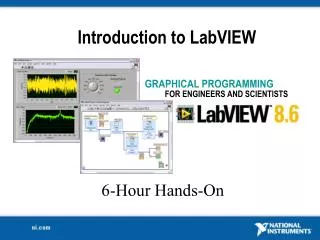
Introduction to LabVIEW 3-Hour Hands-On – modified by Milica Janković GRAPHICAL PROGRAMMING FOR ENGINEERS AND SCIENTISTS
Section I – LabVIEW Environment A. Setting Up Your Hardware • Data Acquisition Devices • NI-DAQmx • Simulated data acquisition B. What Type of Device Should I Use? • Controls Palette • Tools Palette C. Components of a LabVIEW Application • Creating Custom VIs • Dataflow Programming D. Additional Help • Context Help Window • Tips for Working in LabVIEW
A. Setting Up Your Hardware Track A • Data Acquisition Device (DAQ) • Actual USB, PCI, or PXI device • Configured in Measurement and Automation Explorer (MAX) • Simulated Data Acquisition Device (DAQ) • Software simulated at the driver level • Configured in MAX Track B
What Type of Device Should I Use? * The above table may not be representative of all device variations that exist in each category
What is MAX? • Stands for Measurement & Automation Explorer • Configures and organizes all your National Instruments DAQ, PCI/PXI, GPIB, IMAQ, IVI, motion, VISA, and VXI devices • Tests devices Icon Found on Windows Desktop
Demonstration – Setting Up Your Device Track A • Use Measurement and Automation Explorer (MAX) to: • Configure and test your Data Acquisition (DAQ) device
Demonstration – Setting Up Your Device Track B • Use Measurement and Automation Explorer (MAX) to: • Configure and test your Simulated Data Acquisition (DAQ) device
Open and Run LabVIEW Start»All Programs»National Instruments LabVIEW 8.6 » Startup Screen: Start from a blank VI: New»Blank VI Start from an example: Examples»Find Examples… or
LabVIEW Programs Are Called Virtual Instruments (VIs) • Each VI has2 windows • Front Panel • User interface (UI) • Controls = inputs • Indicators = outputs • Block Diagram • Graphical code • Data travels on wires from controls through functions to indicators • Blocks execute by data flow
(Place items on the front panel window) Controls Palette Customize Palette View Control: Numeric Indicator: Numeric Slide
What Types of Controls and Indicators Are Available? Express Controls Palette • Numeric Data • Number Input and Display • Analog Sliders, Dials, and Gauges • Boolean Data • Buttons and LEDs • Array and Matrix Data • Numeric Display • Chart • Graph • XY Graph • Intensity Graph • 3D Graph: Point, Surface, and Model • Decorations • Tab Control • Arrows • Other • Strings and Text Boxes • Picture/Image Display • ActiveX Controls
Control and Indicator Properties • Properties are characteristics or qualities about an object • Properties can be found by right-clicking on a control or indicator • Properties include: • Size • Color • Plot style • Plot color • Features include: • Cursors • Scaling
Functions (and Structures) Palette (Place items on the block diagram window) Structure: While Loop
What Types of Functions Are Available? Express Functions Palette • Input and Output • Signal and data simulation • Real signal acquisition and generation with DAQ • Instrument I/O Assistant (Serial, USB, GPIB) • ActiveX for communication with other programs • Analysis • Signal processing • Statistics • Advanced math and formulas • Continuous time solver • Storage • File I/O
What Types of Functions Are Available? • Express VIs: interactive VIs with configurable dialog page (blue border) • Standard VIs: modularized VIs customized by wiring(customizable) • Functions: fundamental operating elements of LabVIEW; no front panel or block diagram(yellow)
Searching for Controls, VIs, and Functions • Palettes are filled with hundreds of VIs • Press the search button to index all VIs for text searching • Click and drag an item from the search window to the block diagram • Double-click an item to open the owning palette
Status Toolbar Run Button Continuous Run Button Abort Execution Additional Buttons on the Diagram Toolbar Execution Highlighting Button Retain Wire Values Button Step Function Buttons
Dataflow Programming • Block diagram execution • Dependent on the flow of data • Block diagram does NOT execute left to right • Node executes when data is available to ALL input terminals • Nodes supply data to all output terminals when done
Debugging Techniques • Finding Errors • Execution Highlighting • Probes Click on broken Run button. Window showing error appears. Click on Execution Highlighting button; data flow is animated using bubbles. Values are displayed on wires. Right-click on wire to display probe; it shows data as it flows through wire segment. You can also select Probe tool from Tools palette and click on wire.
Demonstration : Creating a VI for acquisition Front Panel Window Graph Indicator Block Diagram Window Output Terminal Boolean Control Input Terminals
Context Help Window • Help»Show Context Help, press the <Ctrl-H> keys • Hover cursor over object to update window • Additional Help • Right-click on the VI icon and choose Help, or • Choose “Detailed help” on the context help window
Tips for Working in LabVIEW • Keystroke Shortcuts • <Ctrl-H> – Activate/Deactivate Context Help Window • <Ctrl-B> – Remove Broken Wires from Block Diagram • <Ctrl-E> – Toggle between Front Panel and Block Diagram • <Ctrl-Z> – Undo (also in Edit menu) • Tools»Options… – Set Preferences in LabVIEW • File»VI Properties – Configure VI Appearance, Documentation, and so on
Section II – Elements of Typical Programs A. Loops • While Loop • For Loop • Building Arrays with Loops B. SubVIs C. Decision Making and File I/O • Case Structure • Select (simple If statement) • File I/O Programming Model – Under the Hood
A. Loops While Loop • While Loop • Terminal counts iterations • Always runs at least once • Runs until stop condition is met For Loop • For Loop • Terminal counts iterations • Runs according to input N of count terminal
Drawing a Loop 2. Enclose code to be repeated 1. Select the structure 3. Drop or drag additional nodes and then wire
Building Arrays with Loops (Auto-Indexing) Auto-Indexing Enabled • Loops can accumulate arrays at their boundaries with auto-indexing • For Loops auto-index by default • While Loops output only the final value by default • Right-click tunnel and enable/disable auto-indexing Wire becomes thicker 1D Array 0 1 2 3 4 5 Auto-Indexing Disabled Wire remains the same size Only one value (last iteration) is passed out of the loop 5
Creating an Array (Step 1 of 2) From the Controls»Modern»Array, Matrix, and Cluster subpalette, select the Array icon. Drop it on the front panel.
Create an Array (Step 2 of 2) • Place an array shell. • Insert data type into the shell (i.e., numeric control).
Creating SubVIs • Enclose area to be converted into a subVI • Select Edit»Create SubVI from the Edit menu
LabVIEW Functions and SubVIs Operate Like Functions in Other Languages Function Pseudo Code function average (in1, in2, out) { out = (in1 + in2)/2.0; } SubVI Block Diagram Calling Program Pseudo Code main { average (in1, in2, pointavg) } Calling VI Block Diagram
How Do I Make Decisions in LabVIEW? • Case Structures • Select (b) (a) (c)
File I/ File I/O File I/O – passing data to and from files • Files can be binary, text, or spreadsheet • Write/Read LabVIEW Measurements file (*.lvm) Writing to *.lvm file Reading from *.lvm file
File I/O Programming Model – Under the Hood Open/Create/Replace File Read and/orWrite to File Close File Check for Errors
Section III–Presenting Your Results A. Charts B. Graphs
Charts – Add 1 Data Point at a Time with History Waveform chart – special numeric indicator that can display a history of values • Chart updates with each individual point it receives Controls»Express»Graph Indicators»Chart
Graphs – Display Many Data Points at Once • Waveform graph – special numeric indicator that displays an array of data • Graph updates after all points have been collected • May be used in a loop if VI collects buffers of data Controls»Express»Graph Indicators»Graph
LabVIEW Project • Group and organize VIs • Manage hardware and I/O • Manage VIs for multiple targets • Build libraries and executables • Manage large LabVIEW applications • Enable version tracking and management
Additional Resources • NI Academic Web and Student Corner • ni.com/academic • ni.com/textbooks • Get your own copy of the LabVIEW Student Edition • NI KnowledgeBase • ni.com/kb • NI Developer Zone • ni.com/devzone • LabVIEW Certification • LabVIEW Fundamentals Exam (free on ni.com/academic) • Certified LabVIEW Associate Developer Exam (industry-recognized certification) • LabVIEW Student Competition • Student Design Competition (http://www.ni.com/studentdesign) • Labview Competition, Belgrade (www.etf.rs, http://bmit.etf.rs)


![I like [ hour / our ] team the best. hour our](https://cdn1.slideserve.com/2584921/slide1-dt.jpg)