Download

1 / 4
40 likes | 206 Vues
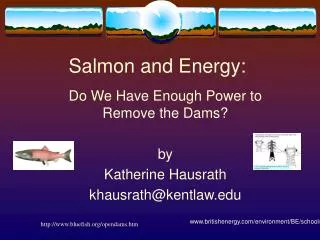
Where Have All the Salmon Gone?. Graphing Results. 1880s: Canning of Chinook increases 6x. 1930s-50s: logging increases in lower river system. World War I. First attempts to regulate fishing. 1980s: Regulations ban ocean catch of Chinook, Coho.

E N D
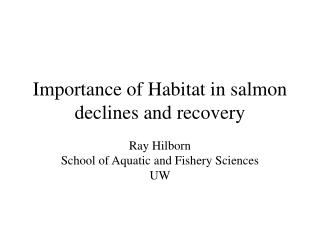
Where Have All the Salmon Gone? Graphing Results
1880s: Canning of Chinook increases 6x 1930s-50s: logging increases in lower river system World War I First attempts to regulate fishing 1980s: Regulations ban ocean catch of Chinook, Coho Regulations: only gill netters allowed on river. 1930s: Bonneville Dam is built Nitrogen super-saturation around dams kills small fish 1950s: 8 new dams built 1920s: First ocean trawlers 1960s-80s: Hatchery techniques improve Canneries start using other fish species 1940s: 4 new dams built 1866: First fish cannery 1950s: massive hatchery program
On the back of your graph: • What advantages and drawbacks are there to using fish catch data as a way of measuring salmon populations? • Which human-caused factors had the most effect on salmon populations? Why? • Should salmon recovery efforts focus only on habitat restoration, only on reducing fishing and predation, or both? Why? Find and cite a section in your textbook that supports your answer.