Download
1 / 25
250 likes | 379 Vues
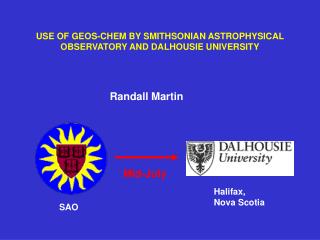
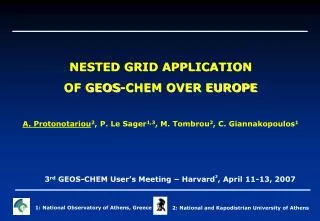
NESTED GRID APPLICATION OF GEOS-CHEM OVER EUROPE A. Protonotariou 2 , P. Le Sager 1,3 , M. Tombrou 2 , C. Giannakopoulos 1. 3 rd GEOS-CHEM User’s Meeting – Harvard 3 , April 11-13, 2007. 1: National Observatory of Athens, Greece. 2: National and Kapodistrian University of Athens. Scope.

E N D
NESTED GRID APPLICATION OF GEOS-CHEM OVER EUROPE A. Protonotariou2, P. Le Sager1,3, M. Tombrou2, C. Giannakopoulos1 3rd GEOS-CHEM User’s Meeting – Harvard3, April 11-13, 2007 1: National Observatory of Athens, Greece 2: National and Kapodistrian University of Athens
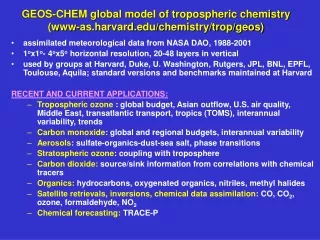
Scope • Apply the GEOS-CHEMnested grid formulationover Europe • Compare GEOS-CHEM nested grid formulation results with : • results from the global GEOS-CHEM model • observations • Study Carbon Monoxide (CO) at surface over Europe National Observatory of Athens, Greece National and Kapodistrian University of Athens
GEOS-CHEM previous nested grid studies • Wang et al. [2004] They first modified and applied the GEOS-CHEMnested grid over Asia in a CO only application (spring 2001) • Li et al. [2005] North America - Full chemistry nested grid simulation (summer 2000) National Observatory of Athens, Greece National and Kapodistrian University of Athens
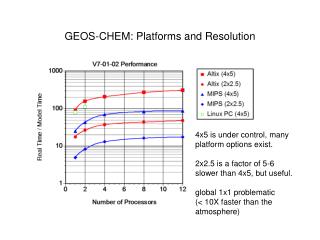
Nested grid of GEOS-CHEM over Europe Geos-Chem : v07-01-02 Met. data : GEOS-3 • Simulations: • LO (LOwResolution):Global full chemistry run • 40x50 horizontal grid resolution • Runs for two-year period (2000-2001) • Results for the second year (1-y model spin-up) • Save boundary concentrations around nested window • HI(HIgh Resolution):Nested grid - full chemistry over Europe • 10x10 horizontal grid resolution • Run for 2001 over Europe • Boundaries from global run (LO) • Vertical levels as in LO
Nested grid of GEOS-CHEM over Europe LO:Global simulation (40x50) HI:Simulation in Europe Nested window(10x10)
Terrain heights HI (10x10) LO (40x50) 1630 m 1630 m 1000 1000 500 500 0 0 • Differences in the representation of the spatial scales for significant changes in terrain • Depiction of a number of specific topographic features i.e. Alps • Coasts • Higher altitudes for HI
Results: CO mixing ratios @ surface Spatial distribution of monthly mean CO mixing ratios National Observatory of Athens, Greece National and Kapodistrian University of Athens
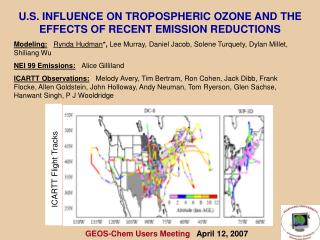
HI depicts patterns in detail • HIpredicted higher values • Max diff. 180ppbv /40% Monthly mean CO mixing ratios - January 2001 LO HI High polluted areas Central Europe: Germany The Netherlands U.K Eastern Europe: Russia 520 [ppbv] 40 [%] 520 [ppbv] 100 [ppbv] -100 250 250 -10 350 350 -20 10 450 450 30 20 -180 100 100 -40 -150 150 150 -30 % diff: LO- HI diff: LO- HI Max. diff. : 180ppbv Max. diff. 40%
Highest CO mixing ratios indicate for regions of high anthro emissions Monthly mean CO mixing ratios vs emissions LO HI January 2001 520 [ppbv] 520 [ppbv] 250 250 350 350 450 450 100 100 150 150 Anthrop. emissions (HI) Anthrop. emissions (LO) Anthrop. Emissions (HI) Anthrop. Emissions (LO) Tg
Monthly mean CO mixing ratios - July 2001 CO lower compare to winter => Follows CO annual cycle Lower diff. between HI and LO in comparison to winter LO HI 30 [%] 520 [ppbv] 520 [ppbv] 50 [ppbv] 250 250 -10 -50 0 350 350 0 450 450 20 30 -100 100 100 -35 -80 150 150 -25 % diff: LO- HI diff: LO- HI Max. diff. : 100ppbv Max. diff. 35%
Monthly mean CO mixing ratios - July 2001 HI LO Lower CO concentrations over Europe in summer Anthrop. Emissions (HI) Anthrop. Emissions (LO)
31 rural background stations over Europe in: • France • The Netherlands • Germany • Austria • Italy • Switzerland • Poland Airbase :(http://air-climate.eionet.europa.eu./databases/airbase/index-html) National Observatory of Athens, Greece National and Kapodistrian University of Athens
Correlation depends on the emissions in a grid HIvs LOmixing ratios Higher emissions => higher concentrations HI<LO HI<LO HI>LO HI>LO emission rate HI<LO emission rate HI<LO HI<LO HI<LO HI<LO HI>LO HI>LO HI>LO HI>LO HI>LO HI>LO HI<LO HI<LO HI>LO HI>LO HI<LO HI<LO HI<LO HI<LO HI<LO HI LO
Daily average CO mixing ratios for 2001 Observations: black boxes - LO: black solid line -HI:Red: winter/ Blue: spring/Green: summer/Purple: autumn
At most stations LO and HI reproduced very well: the high CO mixing ratio levels in winter HI LO =>Very good representation of CO annual cycle the low CO mixing ratio levels in summer
Scatter plots : Model vsObservations X/Y axis :1000ppbv HI (10x10) Most of the simulated values for HI lie around the 1:1 line, indicating a very good agreement between the model simulations and the observations. Observations Red: winter Blue: spring Green: summer Purple: autumn
Statistical analysis Mean bias (ppbv) and normalized mean bias (%) show the under- or over- estimation. These metrics assume observations are the absolute truth (Boylan and Russel, 2005) Red: winter Blue: spring Green: summer Purple: autumn Seasonal performance In winter &autumnthe model underestimated the observations Inspring&summerthe model overestimated the observations Largest underestimation : in winter for LO (13.58ppbv) HI performs better (11.64ppbv) Largest overestimation is in summer for LO (10.77ppbv).HI performs better (7.57ppbv)
Good correlation: all stations in Netherlands LO : R2=0.45-0.68 HI: R2=0.6-0.73 Poor correlation all stations in France LO : R2=0.1-0.27 HI: R2=0.1-0. 33 Observations: black boxes - LO: black solid line -HI:Red: winter/ Blue: spring/Green: summer/Purple: autumn
STATISTICAL ANALYSIS Full year for one station in NL HI MB=11.72ppbv NMB=4.55% R2=0.68 LO MB=-50.26ppbv NMB=-19.49% R2=0.45
Hourly data Example for a selected station in NL 16-18 January 2001
Conclusions • GEOS-CHEMnested grid formulation over Europe (HI) reproduces • very well the CO concentrations and CO annual cycle • The largest differences in maximum CO mixing ratios between the • GEOS-CHEMnested grid and global simulation • were found over : • a) the areas with the higher anthropogenic emissions • b) in rural areas located close to large industrial areas • These discrepancies become more obvious during the winter • when the limited atmospheric mixing prohibits the • primary pollutants from the wider vicinity.
Conclusions (continued) • The nested grid run HI shows in winter an ability to simulate more accurate the higher values • HI shows a better performance for all seasons in comparison to LO • HI showed a very good correlation for most of the stations • Large differences between HI and LO for individual cases National Observatory of Athens, Greece National and Kapodistrian University of Athens
Future work • Tagged CO in nested grid: to estimate contribution from all sources and transport -- Emission shut off ->done • Comparison to satellite results • Vertical profiles • Complete the nested grid study for O3 • Done: Literature review, measurements from network in Europe,Tagged Ox • Future climate runs –emission scenario for 2100 –changes in temperature provide useful info for changes in chemistry in a climate change world
Thank you!! A little info about us... Anna Protonotariou MSc. Environmental Physics, PhD candidate, UOA Department of Applied Physics, University of Athens, Greece aprot@phys.uoa.gr Philippe Le Sager Research Associate Division of Engineering and Applied Science, Harvard University, U.S.A lesager@fas.harvard.edu Maria Tombrou Assistant Professor, UOA Department of Applied Physics, University of Athens, Greece mtombrou@phys.uoa.gr Christos Giannakopoulos Researcher,Institute for Environmental Research and Sustainable Development National Observatory of Athens cgiannak@meteo.noa.gr
National Observatory of Athens, Greece National and Kapodistrian University of Athens References • Bey I., D. J. Jacob, R. M. Yantosca, J. A. Logan, B. Field, A. M. Fiore, Q. Li, H. Liu, L. J. Mickley, and M. Schultz, (2001a), Global modeling of tropospheric chemistry with assimilated meteorology: Model description and evaluation, J. Geophys. Res., 106, 23,073-23,096 • Boylan, James W. and Armistead G. Russell, 2006: PM and light extinction model performance metrics, goals, and criteria for three-dimensional air quality models. Atmos. Env.. 40, 4946-4959 • Li, Q., D. Jacob, R. Park, Y. Wang, C. Heald, R. Hudman, R. Yantosca, R. Martin, and M. Evans, North American pollution outflow and the trapping of convectively lifted pollution by upper-level anticyclone, J. Geophys. Res., 110, D10301, 2005 • Wang, Y., M.B. McElroy, D.J. Jacob, R.M. Yantosca, A nested grid formation for chemical transport over Asia: applications to CO, J. Geophys. Res., 109, D22307, oi:10.1029/2004jd005237, 2004