Queueing Theory
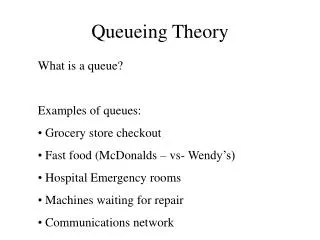
Queueing Theory. The study of queues – why they form, how they can be evaluated, and how they can be optimized. Building blocks – arrival process and a service process. Some characteristics of arrival and service processes.

Queueing Theory
E N D
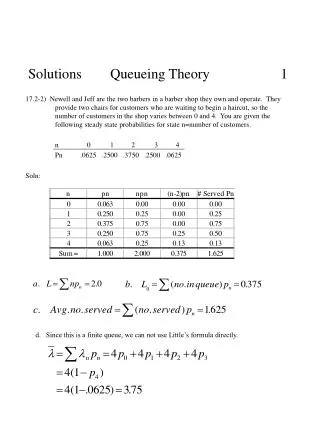
Presentation Transcript
The study of queues – why they form, how they can be evaluated, and how they can be optimized. Building blocks – arrival process and a service process.
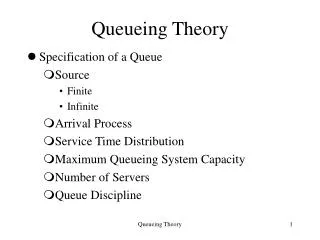
Some characteristics of arrival and service processes Arrival process – individually/in groups, independent/correlated, single source/multiple sources, infinite/finite population, limited/unlimited capacity. Service process – single/multiple servers, single/multiple stages, individually/in groups, independent/correlated, service discipline (FCFS/priority).
A Common notation GX/GY/k/N N: maximum number of customers allowed G: distribution of inter-arrival times G: distribution of service times k: number of servers X: distribution of arrival batch (group) size Y: distribution of service batch size
Common examples M/M/1 M/G/1 M/M/k M/M/1/N MX/M/1 GI/M/1 M/M/k/k
Fundamental quantities L: expected number of customers in the system, L =E(n). LQ: expected number of customers waiting in queue. W: expected time a customer spends in the system. WQ: expected time a customer spends waiting in queue E[S]: expected time customer spends in service. l: customer arrival rate, l = limt ∞N(t)/t, where N(t) is the number of arrivals up to time t.
Fundamental relationships L = LQ + Ns W = WQ + E(S) L = lW LQ = lWQ Ns = lE(S) The relationship L = lW is often referred to as Little’s law.
A heuristic proof Number in system 3 2 1 t1 t2t3 t4 t5 t6 t7 T
L = [1(t2-t1)+2(t3-t2)+1(t4-t3)+2(t5-t4)+3(t6-t5)+2(t7-t6)+1(T-t7)]/T = (area under curve)/T = (T+t7+t6-t5-t4+t3-t2-t1)/T W = [(t3-t1)+(t6-t2)+(t7-t4)+(T-t5)]/4 = (T+t7+t6-t5-t4+t3-t2-t1)/4 = (area under curve)/N(T)
L = (area under curve)/T, W = (area under curve)/N(T) LT=WN(T) L=WN(T)/T Since as T∞, N(T)/T l, L= lW as T∞. A similar heuristic proof can be used to show LQ = lWQ and Ns = lE(S).
Why do queues form? • Case 1 • Customers arrive at regular & constant intervals • Service times are constant • Arrival rate < service rate (l< m) • WQ = 0 • W = WQ + E(S) = E(S) • L = lW = lE(S) • LQ = lWQ = 0 • r = lE(S) • TH (output/throughput rate) = l
Why do queues form? • Case 2 • Customers arrive at regular & constant intervals • Service times are constant • Arrival rate > service rate (l> m) • WQ = ∞ • W = WQ + E(S) = ∞ • L = lW = ∞ • LQ = lWQ = ∞ • r=l/m >1 (but utilization is actually 1) • TH (output/throughput rate) = m
Case 3 • Customers arrive at regular & constant intervals • Service times are not constant • Arrival rate < service rate (l< m) • Example: • Inter-arrival time = 8 min • Average service time = 6 min
r = 6/8 = 0.75 • TH = 1/8 parts/min = 7.5 parts/hour • WQ = ? • Lq = ?
Conclusion 1: If customers arrive at a faster rate than the service rate, the system becomes instable and infinitely large queues will form. • Conclusion 2: In the presence of variability, customers will generally wait for processing and a queue in front of the processing unit will build up.
In managing queueing systems, we must alway strive to reduce variability while allowing for enough capacity
Example Example: Customers arrive according to a Poisson process with rate of 1 per every 12 minutes and that the service time is exponential at a rate of one service per 8 minutes. What is L and W? What happens if arrival rate increases by 20%? If there is a waiting cost of $2 per minute a customer spends in the system, what is the total cost per minute incurred in both cases?
Example A 20% increase in arrival rate leads to a 100% increase in number of customers!
Example: A service facility with a finite queue size of N has service rate m and an arrival rate l. Each customer that is served generates $A. Service rate can be increased. However, there is a cost $cm per unit time for operating a facility with rate m. What is the optimal choice of m?
The G/G/1 queue If (1) l < m, (2) the distributions of customer service time and inter-arrival times are stationary, and (3) customers are served on a first come, first served (FCFS) basis, then average waiting time in the queue can be approximated as follows: waiting time in a M/M/1 queue
The G/G/m queue When there are m parallel servers, then average waiting time can be approximated as follows:
Examples • m = 1 • CA = CS = 1 • m = 1 • Case 1: r = 0.50 W = 2, L = 1 • Case 2: r = 0.66 W = 3, L = 1.98 • Case 3: r = 0.75 W = 4, L = 3 • Case 4: r = 0.80 W = 5, L = 4 • Case 5: r = 0.90 W = 10, L = 9 • Case 6: r = 0.95 W = 20, L = 19 • Case 7: r = 0.99 W = 100, L = 99
Examples • m = 1 • CA = 1 • m = 1 • r = 0.8 • Case 1: cS = 0 W = 3, L = 2.4 • Case 2: cS = 0.5 W = 4, L = 3.2 • Case 1: cS = 1 W = 5, L = 4 • Case 1: cS = 1.5 W = 6, L = 4.8 • Case 1: cS = 2 W = 7, L = 5.6
Network of Queues • Two servers in series • Customers arrive to server 1 according to a Poisson process with rate l • Service times are exponentially distributed at servers 1 and 2 with rates m1 and m2, respectively • There is always enough waiting room between the two servers
Server 1 alone is simply an M/M/1 queue. Then • If server 2 alone is also an M/M/1 queue (this is actually true), then • If the number of customers at servers 1 and 2 are independent (this is also true), then
The results generalize to k servers in series. Each server behaves like an M/M/1 queue and number of customers at each server are independent of the number of customers at other servers.