The Information Visualization MOOC Katy Börner
320 likes | 509 Vues
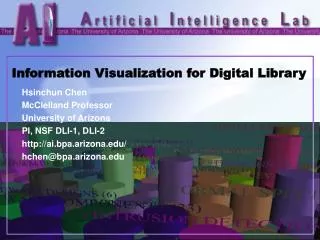
The Information Visualization MOOC Katy Börner Cyberinfrastructure for Network Science Center, Director Information Visualization Laboratory, Director School of Library and Information Science Indiana University, Bloomington, IN katy@indiana.edu With special thanks to the members at the

The Information Visualization MOOC Katy Börner
E N D
Presentation Transcript
The Information Visualization MOOC Katy Börner Cyberinfrastructurefor Network Science Center, Director Information Visualization Laboratory, Director School of Library and Information Science Indiana University, Bloomington, IN katy@indiana.edu With special thanks to the members at the Cyberinfrastructurefor Network Science Center Exploiting Big Data Semantics for Translational Medicine Workshop Indiana University Bloomington, Indiana Memorial Union March 25-26, 2013
MOOCs In 2012, Google hosted three massive open online courses (MOOCs) collectively reaching over 400,000 registrants. By the end of 2013 more than 250 courses will be run using the Google, Coursera, Udacity, EdX, and other platforms. 3
The Information Visualization MOOC ivmooc.cns.iu.edu Students come from 93 countries 300+ faculty members #ivmooc 5
Instructors Katy Börner – Theory Parts Instructor, Professor at SLIS David E. Polley – Hands-on Parts CNS Staff, Research Assistant with MIS/MLS Teaches & Tests Sci2 Tool Scott B. Weingart – Client Work Assistant Instructor, SLIS PhD student
Course Schedule Course started on January 22, 2013 • Session 1 – Workflow design and visualization framework • Session 2 – “When:” Temporal Data • Session 3 – “Where:” Geospatial Data • Session 4 – “What:” Topical Data Mid-Term Students work in teams with clients. • Session 5 – “With Whom:” Trees • Session 6 – “With Whom:” Networks • Session 7 – Dynamic Visualizations and Deployment Final Exam 8
Different Question Types Find your way Descriptive & Predictive Models Find collaborators, friends Terabytes of data Identify trends 9
Plug-and-Play Macroscopes cishell.org Börner, Katy. (March 2011). Plug-and-Play Macroscopes. Communications of the ACM, 54(3), 60-69. http://www.scivee.tv/node/27704 10
Unit Structure The course and each unit has three components: Theory: Videos and Slides Self-Assessment (not graded) Hands-on: Videos and Slides & Wiki pages with workflows Homework (not graded) Client Work: Using Drupal Marketplace (peer review)
Theory Unit Structure Each theory unit comprises: • Examples of best visualizations • Visualization goals • Key terminology • General visualization types and their names • Workflow design • Read data • Analyze • Visualize • Discussion of specific algorithms
Different Levels of Abstraction/Analysis Macro/Global Population Level Meso/Local Group Level Micro Individual Level
Needs-Driven Workflow Design DEPLOY Validation Interpretation Graphic Variable Types Modify reference system, add records & links Visualization Types (reference systems) Stakeholders Visually encode data Overlay data Select visualiz. type Types and levels of analysis determine data, algorithms & parameters, and deployment Data READ ANALYZE VISUALIZE
Needs-Driven Workflow Design DEPLOY Validation Interpretation Stakeholders Visually encode data Overlay data Select visualiz. type Types and levels of analysis determine data, algorithms & parameters, and deployment Data READ ANALYZE VISUALIZE
Needs-Driven Workflow Design DEPLOY Validation Interpretation Stakeholders Visually encode data Overlay data Select visualiz. type Types and levels of analysis determine data, algorithms & parameters, and deployment Data READ ANALYZE VISUALIZE
Visualization Types vs. Data Overlays Plus, add a title, labels, legend, explanatory text, and author info.
Visualization Types vs. Data Overlays Plus, add a title, labels, legend, explanatory text, and author info.
IVMOOC Social Media Stream Before, during, and after the course, please use tag “ivmooc” on • Twitter to share links to insightful visualizations, conferences and events, or relevant job openings. • Flickr to upload your own visualizations or tag visualizations by others. We hope to use this course to create a unique, real-time data stream of the best visualizations, experts, and companies that apply data mining and visualization techniques to answer real-world questions.
Grading All students are asked to create a personal profile to support working in teams. Final grade is based on Midterm (30%), Final (40%), Client Project (30%). • Weekly self-assessments are not graded. • Homework is graded automatically. • Midterm and Final test materials from theory and hands-on sessions are graded automatically. • Client work is peer-reviewed via online forum. All students that receive more than 80% of all available points get an official certificate/badge.
DiogoCarmo 23
DiogoCarmo 26
camaal 28
References Börner, Katy, Chen, Chaomei, and Boyack, Kevin. (2003). Visualizing Knowledge Domains. In Blaise Cronin (Ed.), ARIST, Medford, NJ: Information Today, Volume 37, Chapter 5, pp. 179-255. http://ivl.slis.indiana.edu/km/pub/2003-borner-arist.pdf Shiffrin, Richard M. and Börner, Katy (Eds.) (2004). Mapping Knowledge Domains. Proceedings of the National Academy of Sciences of the United States of America, 101(Suppl_1). Börner, Katy, Sanyal, Soma and Vespignani, Alessandro (2007). Network Science. In Blaise Cronin (Ed.), ARIST, Information Today, Inc., Volume 41, Chapter 12, pp. 537-607. http://ivl.slis.indiana.edu/km/pub/2007-borner-arist.pdf Börner, Katy (2010) Atlas of Science. MIT Press. http://scimaps.org/atlas Scharnhorst, Andrea, Börner, Katy, van den Besselaar, Peter (2012) Models of Science Dynamics. Springer Verlag. 30
Acknowledgments We would like to thank Miguel I. Lara and his colleagues at the Center for Innovative Teaching and Learning for instructional design support, Samuel Mills for designing the web pages, Robert P. Light and Thomas Smith for extending the GCB platform, and Mike Widmer and Mike T. Gallant for adding the Forum. Support comes from CNS, CITL, SLIS, SOIC, and Google. The tool development work is supported in part by the Cyberinfrastructure for Network Science Center and the School of Library and Information Science at Indiana University, the National Science Foundation under Grants No. SBE-0738111 and IIS-0513650, the US Department of Agriculture, the National Institutes of Health, and the James S. McDonnell Foundation. Visualizations used in the course come from the Places & Spaces: Mapping Science exhibit, online at http://scimaps.org, and from the Atlas of Science: Visualizing What We Know, MIT Press (2010). 31