LTE Analysis for AMI Headend and DAP Interface: Capacity and Throughput Evaluation
110 likes | 242 Vues
This analysis evaluates the performance of LTE for Advanced Metering Infrastructure (AMI) headend and Device Application Protocol (DAP) interfaces, focusing on sector throughput under different conditions. It assumes uniformly distributed user equipment (UE) in sectors and neglects inter-sector interference for preliminary calculations. The study examines traffic characteristics, propagation models, and SNR calculations to estimate sector throughput in urban and rural areas. Required throughput based on service demands demonstrates the capacity needed for successful deployment of smart meters, with implications for smart grid technologies.

LTE Analysis for AMI Headend and DAP Interface: Capacity and Throughput Evaluation
E N D
Presentation Transcript
Analysis of LTE for AMI Headend/DAP Interface Michael SouryalSeptember 3, 2010
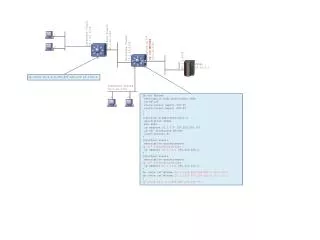
Assumptions Topology • UEs uniformly distributed in the sector • 3 sectors per cell site • Inter-sector interference neglected (for now) Traffic • No bundling of messages from DAP to Headend and vice versa: each message to/from a meter is sent individually over the LTE network. LTE Configuration • 5 MHz per uplink and downlink • SISO antennas • MCS selected adaptively to maximize throughput
LTE Device Parameters Source: 3GPP TR 36.942 V8.2.0 *eNodeB antenna radiation pattern
Propagation Model • Path loss (dB) with distance R (km): X represents lognormal shadowing with a standard deviation of 10 dB. • Path loss parameters: Source: 3GPP TR 36.942 V8.2.0
Calculation of SNR • Received power (dBm) • Noise power spectral density (dBm/Hz) • Received SNR per subcarrier symbol (dB)
Coverage Analysis • Maximum transmitter-receiver separation, Rmax • Maximum distance along antenna boresight at which MCS 0 can be supported with 10-3 BLER (neglecting shadowing) • Values of Rmax for 0 = 2.4 dB:
Calculation of Sector Throughput Steps • Calculate the probability that MCS i will be used:(SNR varies with location in cell and shadowing.) • Let Si be the throughput of MCS i. • Then, the average (aggregate) throughput in the sector is: • Calculate sector throughput separately for the uplink and downlink.
Sector Throughput Results Urban Area Rural Area Rmin = 0.2 km Rmin = 1 km
Average Capacity per Smart Meter • Ratio of sector aggregate throughput to number of smart meters in sector:where is the meter density (number of SMs per sq. km.) • Example meter densities
Average Capacity per Smart Meter Urban Area Rural Area
Required Throughput Assumptions • Required application throughputs based on 3 use cases: Service Switch (SS), Meter Reading (MR), and Plug in Hybrid Electric Vehicle (PHEV)1 • 42-byte overhead per message Required Throughputs • More than two orders of magnitude below average capacity at coverage limits 1 M. Souryal, C. Gentile, D. Griffith, D. Cypher and N. Golmie, “A Methodology to Evaluate Wireless Technologies for the Smart Grid,” to appear in Proc. IEEE SmartGridComm, Oct. 2010.