Download
1 / 14
140 likes | 260 Vues
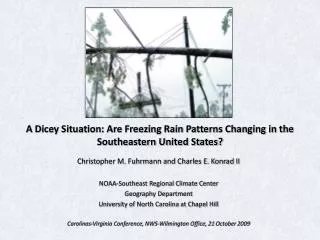
A Dicey Situation: Are Freezing Rain Patterns Changing in the Southeastern United States?. Christopher M. Fuhrmann and Charles E. Konrad II NOAA-Southeast Regional Climate Center Geography Department University of North Carolina at Chapel Hill

E N D
A Dicey Situation: Are Freezing Rain Patterns Changing in the Southeastern United States? Christopher M. Fuhrmann and Charles E. Konrad II NOAA-Southeast Regional Climate Center Geography Department University of North Carolina at Chapel Hill Carolinas-Virginia Conference, NWS-Wilmington Office, 21 October 2009
Research Context • Increase in the number of studies looking at the temporal variability and historical fluctuations of extreme weather events • Useful in identifying historical analogs and assessing impacts of climate variability and change (past, present, and future) • To date, very few studies have investigated the temporal variability of freezing rain (FZRA) events and the possible impacts of climate change • South-central Canada: Percentage increases in the occurrence of FZRA events are likely to be between 40-85% by 2050 and as much as 135% by 2080, compared to the 1959-2001 average across the region (Cheng et al., 2007) • Changnon and Bigley (2005): only study found that examined the temporal variability and historical fluctuations in FZRA days; considered spatial patterns in these fluctuations across the US
Objectives • Determine the historical fluctuations in the intensity of FZRA events in the Southeast United States from 1950 to 2007 • Assess current trends in FZRA intensity in the context of large-scale ocean-atmosphere signals and the synoptic airstreams connected with mid-latitude weather systems
Study Area: The Southeast United States Locations of first-order NWS stations used to identify FZRA from 1950 to 2007
Northern half of study area Southern half of study area Temporal distributions of FZRA days, based on 10-yr totals (1949-1999) (Changnon and Bigley, 2005)
Methodology • FZRA events (ice storms) identified from hourly precipitation measurements at the 18 first-order NWS stations • These stations have continuous records dating back to 1950 and the FZRA observations available in the current dataset have been quality-controlled, including ASOS from 1996-present (see Changnon and Creech, 2003 and Ramsay, 1997). • Events were defined by the occurrence of a contiguous period of precipitation with at least one observation of measurable FZRA as discerned from Hourly Precipitation Data (HPD) • A regional event magnitude (intensity) was estimated by computing the mean FZRA total across the 18 stations
Seasonal Intensities of Freezing Rain Events (1950-2007) Black line = 5-yr running average Top Q 50th P Bot Q Values expressed as percentiles of the 57-yr distribution
Going a Step Further – What Might Explain these Trends? One possibility: relationship to SST anomalies over the north Atlantic Ocean Atlantic Multidecadal Oscillation Knight et al. (2005)
Ramos da Silva et al. (2006) used a regional atmospheric model (RAMS) to establish a relationship between winter precipitation and Atlantic SST anomalies –But what’s the mechanism? SST +4° SST (no anom.) SST –4°
Observed Connection Between FZRA Intensity and the AMO Trends in FZRA, 1950-2007 AMO Phase (SST Anom.), 1950-2008
Are Southeast Ice Storms Dynamically Connected to the Atlantic Ocean? • How might we determine this? One way is to “back-track” the air arriving in the melting layer (i.e., where did it come from?) Fuhrmann and Konrad (2008)
These events may also be thermodynamically connected to the Atlantic Ocean Fuhrmann and Konrad (2008)
Conclusions • Much variability in the annual trends in FZRA intensity in the Southeast from 1950 to the late 1990s; pattern seems to correspond well with the decadal analysis performed by Changnon and Bigley • Periods of high FZRA intensity: early-mid 1960s; late 1970s to early 1980s • More recent trend (since mid-1990s): over the 14 winter seasons from 1994-2007, 6 of these (43%) had exceptional FZRA totals • This may be tied physically to positive anomalies in Atlantic SSTs (AMO+) • Synoptic-scale back-trajectory analyses suggest that air parcels arriving in the elevated melting layer over the region may be acquiring sensible heat through energy fluxes in the Atlantic marine boundary layer • Will be expanding heavily on this work over the next year…