Modeling Species Interactions: Competition and Equilibrium in Population Dynamics
This document explores systems of differential equations that model interactions between two species, focusing on competition for resources. The analysis includes graphical representations of population changes over time, explores Lotka-Volterra equations to understand predator-prey dynamics, and highlights equilibrium solutions. Key species discussed include flowering plants, insect pollinators, aphids, ladybugs, rabbits, and wolves. By analyzing equilibrium points and phase trajectories, we gain insights into the stability and changes in population dynamics, critical for ecological studies and biodiversity conservation.

Modeling Species Interactions: Competition and Equilibrium in Population Dynamics
E N D
Presentation Transcript
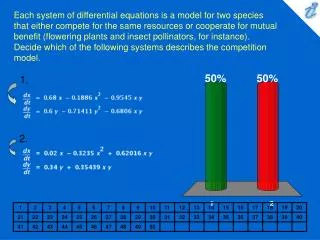
1. 2. Each system of differential equations is a model for two species that either compete for the same resources or cooperate for mutual benefit (flowering plants and insect pollinators, for instance). Decide which of the following systems describes the competition model. • {image} • {image}
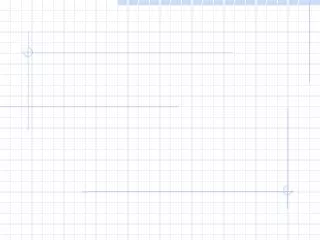
Graphs of populations of two species are shown. Describe how each population changes as time goes by. Select the correct statement. {image} • At t = 3 the population of species 1 reaches a maximum of about 200. • At t = 2 the population of species 2 reaches a maximum of about 100. • At t = 2 the population of species 2 reaches a maximum of about 190
Populations of aphids and ladybugs are modeled by the equations {image} , {image} . Find the equilibrium solutions. • A=9,000,L=400 • A=10,000,L=400 • A=8,000,L=200
We used Lotka-Volterra equations to model populations of rabbits and wolves. Let's modify those equations as follows: {image} , {image} . What is the significance for the equilibrium solution W=0, R=5000? • Both populations are stable • In the absence of wolves, the rabbit population is always 5000 • Zero populations
A phase trajectory is shown for populations of rabbits ( R ) and foxes ( F ). Describe how each population changes as time goes by. {image} • At t = C number of rabbits decreases to about 1000. • At t = B the number of foxes reaches a maximum of about 2400. • At t = B number of rabbits rebounds to 100.