Image processing Image and image sequence compression bases
Image processing Image and image sequence compression bases. Session 2005-2006. Ecole Centrale Marseille. Goal. Give in 2 hours some technics of compression Introduction of mathematical tools Based on information theory. Plan. I) Introduction II) Tools III) Lossless compression

Image processing Image and image sequence compression bases
E N D
Presentation Transcript
Image processing Image and image sequence compression bases Session 2005-2006 Ecole Centrale Marseille
Goal • Give in 2 hours some technics of compression • Introduction of mathematical toolsBased on information theory
Plan I) Introduction II) Tools III) Lossless compression (redundancy) IV) Lossy compression scalar quatization vector quatization V) Norms
Digital images and sequences L L C C Image Sequence Different formats or standards L xC pixels by image RGB,YUV(NTSC,PAL,SECAM) 8 bits / pixel
Formats RGB : red, green blue YUV : Y black and white component U, V color information YCbCr : scaled and offset versions of YUV
Compression : why ? Problem Amount of data Transmission Decrease de bitrate with compression technics Elimination of redundancy Quantization ... Storage
Amount of datas Exemple of format PAL itu-r 601 Resolution : 720 columns and 576 rows YCbCr : 4:2:2 Interlaced (frame ou trame image) Y = 720 x 576 = 414720 CbCr = 2 x 360 x 576 = 414720 Total = 829440 bytes / image Si 25 images / sec (50 trames / sec) Total = 20,7 Mb / sec
Evolution Increase of quality, increase the size of images, a lot of images ... VISION More and more data
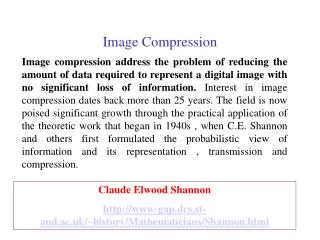
Compression Data compression addresses the problem of reducing the amount of data required to represent given quantity of information NxM pixels Examp l e x0 y0 M Coordinates, radius, gray levels (5 values) N
Plan I) Introduction II) Tools
Transmission of information Mathématical theory of communication W. Weaver et C.E. Shannon source of information destination message message signal source of noise transmitter receiver
compression system model ^ Source encoder Channel encoder Channel Channel decoder Source decoder f f noise encoder decoder exemple Symbol encoder mapper Inverse mapper quantizer Symbol decoder . . . Transform : DCT,FFT,WT SQ,VQ
f(x,y) is fed into the encoder which creates a set of symbols from the input data ^ f f May or may not be an exact replica of ^ f f = Error free (lossless compression) Lossy compression ^ f f
Measures Quality : error between original signal and received signal Bit rate : quantity of bits Possibility : complexity of the system (software or hardware)
Fidélity criteria where 255 is the maximum value of the signal
Fidélity criteria Subjective Value Rating 1 excellent extremely high quality 2 fine high quality 3 passable 4 marginal 5 inferior very poor image 6 unusable can’t watch it
Measuring information A random even E that occurs with probability P(E) is said to contains Units of info Self information P(E)=1 event always occurs P(E)=0 event never occurs P(E)=0.999 ==> small information Log2 bits
Measuring information The average information per source output is ENTROPY H uncertainty information Shannon
Definitions N1 bits before compression N2 bits after compression Compression ratio Relative data redundancy
Technics Image compression Sequence compression Lossless compression : quality is preserved low compression Lossy compression : quality decreases high compression
cameraman Cam10.jpeg 200 623
Cam99.jpg Cam50.jpg 625 625
Plan I) Introduction II) Tools III) Lossless compression (redundancy)
Error free compression Redundancy reduction - coding reduction -interpixel redundancy dpcm,... - psychovisual redundancy
Code length (Longueur de code) Code 1 L=3 Code 2
Huffman coding Assignes fewer bits to the more probable gray levels than to the less probable ===> data compression Most popular Variable-length code Code optimal, code unique
Huffman coding Two steps : 1/ create a series of source reductions by ordering the probabilities of the symbols under consideration and combining the lowest proba symbols into a single symbol that replace them in the next source reduction 2/ code each reduced source, starting with the smallest source and working back to the original source. (start with 0 or 1 arbitrarily)
Example Lavr = 0.4 x 1 + 0.3 x 2 + 0.1 x 3 + 0.1 x 3 + 0.1 x 4 + 0.06 x 5 + 0.04 x 5 = 2.2 bits/symbol Ex : 010100111100 means : a3 a1 a2 a2 a6
Arithmetic coding Un mot de code (nombre) pour une suite de symboles Precision pb
Run length coding Represent each row of an image or bit plane by sequences of lengths that describe successive runs of black and white pixels. fax, standard compression,... Basic concept : code each group of O ’s (1 ’s) encountered in a left to right scan of a row by its lenght. (pattern recognition)
Rlc : example Original data 5 5 10 10 10 6 6 6 6 6 6 18 9 13 bytes 10 bytes 2 5 3 10 6 6 1 18 1 9 Compressed data (10/13=0.77)
Bit plane coding Decompose a multilevel image into a serie of binary images and compress each image (binary) via one of several well known binary compression method Ex : code each group of O ’s (1 ’s) encountered in a left to right scan of a row by its length. 8 binary images 8 bits image
Lemple-Ziv and Welch coding Pattern recognition If a sequence of non identical data values is repeated more than once in the data stream, then this repetition can be exploited to compress the data. 5 10 7 10 6 5 10 7 10 6 10 Original data Compressed data Ca Cb Ca Cb 10
Predictive coding Simple predictive method 2:1 DCT i x x x x j 0 no prediction 1 A 2 B 3 C 4 A+B-C 5 A+(B-C)/2 6 B+(A-C)/2 7 (A+B)/2
Plan I) Introduction II) Tools III) Lossless compression (redundancy) IV) Lossy compression transform quantisation scalar quantisation vector quantisation
Compression system compression coding transform code binary flow coefficients index image ! Attention au mot codage en anglais et français
Transform coding Source image reorder data same information Entropy encoder T quantizer DCT,FFT,WT SQ,VQ 8x8 blocs Compressed image Table specifications Table specifications T-1 Entropy decoder dequantizer Table specifications Table specifications Reconstructed image
Transform coding A transform is used to map the image into a set of transform coefficientswhich are then quantized and coded For natural images, a significant number of coefficients have small magnitudes and can be coarsely quantized (set to zero) without significant distortion. If information of image is well organised ! Goal : decorrelate pixels. Pack as much info as possible into the smallest number of pixels Compression is not achieved during the transform !
Discrete Fourier Transform FDCT 8x8 bloc IDCT Source image
Quantizers Scalar quantizer : one pixel at a time Vector quantizer : group of pixels
Scalar quantization Consider the input x . As a matter of convention x is considered to be mapped toyiR if x lies in ]sj, si+1]. yi belongs to a finite set of L values X= 12.46 Y=12 Degradation of signal
Q output (x) y 7 y 6 y 5 x x x x 0 2 3 1 y x x x x x 4 4 5 6 7 Input y 3 y 2 y 1 Definition Uniform scalar quantizer x1 x2 x3 xN-2 xN-1 Y1 Y2 Y3 YN-1 YN Quantizer design problem select the best Xi and Yj for a particular optimization criterion and pdf of input Decision levels Reconstruction levels
Uniform optimal quantizer (1D) Lloyd-Max quantizer Optimum mean square Criterion : minimise rms for a fixed number of quantization levels Reconstruction levels are the centroids of areas under p(x) over specified decision interval Decision levels are half way between reconstruction levels
Caracteristic Y Y8 x8 x1 x Quantizer error : difference between input and the reproduction level Y1 e x8 x1 x (Truncation error if input is out of range)
Quantization noise Assume e step e quantization error (xi-yi) Hyp : e small and xi equally distributed in [-e/2,e/2] p(e) p(e) is uniform in [-e/2,e/2] 1/e e/2 -e/2 e Noise power
Signal to noise ratio Example : sine wave with amplitude Vm Power of signal Quantization noise