Download
1 / 40
400 likes | 689 Vues
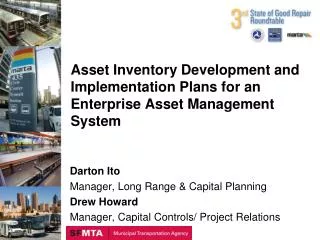
Asset Inventory Development and Implementation Plans for an Enterprise Asset Management System. Darton Ito Manager, Long Range & Capital Planning Drew Howard Manager, Capital Controls/ Project Relations. Agenda. Agency context Assembly of asset inventory Identification of capital projects

E N D
Asset Inventory Development and Implementation Plans for an Enterprise Asset Management System Darton Ito Manager, Long Range & Capital Planning Drew Howard Manager, Capital Controls/ Project Relations
Agenda Agency context Assembly of asset inventory Identification of capital projects Initial application of asset inventory Implementation of enterprise asset management system Next steps for application of asset inventory
Agenda Agency context Assembly of asset inventory Identification of capital projects Initial application of asset inventory Implementation of enterprise asset management system Next steps for application of asset inventory
SF Municipal Transportation Agency • Multi-modal transportation agency • Responsible for the planning, design, construction and operation of the surface transportation network, including: • Pedestrians and streetscapes • Bicycles • Transit and paratransit service • Traffic and parking • Taxi regulation
San Francisco Municipal Railway • Approaching 100 years • Roughly 47 square mile service area • Carries over 200 million customers per year • 80 transit routes • Transit modes operated: • Motor Coach • Trolley Coach • Light Rail Vehicle • Historic Streetcars • Cable Cars
Agenda Agency context Assembly of asset inventory Identification of capital projects Initial application of asset inventory Implementation of enterprise asset management system Next steps for application of asset inventory
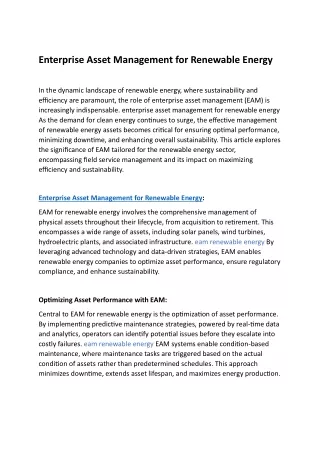
Underlying Need for Asset Inventory Basis for effective asset management Better understand long-term renewal needs Foundation for attaining the Agency’s sustainability goals First step in implementing enterprise asset management system Consider relationship between asset condition, maintenance cost and reliability
MTC Regional Transit Capital Inventory As reinvestment needs increase, how do we best invest limited funds? Inconsistent information across operators and asset types Significant system assets reaching replacement Wide variation in asset holdings and needs by operator Create a consistent and comprehensive transit asset inventory for entire region Used to project the region’s preservation costs into Regional Transportation Plan Support prioritization of capital projects utilizing federal, state, and regional funds that MTC allocates
SFMTA Capital Assets 9 subway & 24 surface light rail stations 6.6 miles of subways & tunnels 71.5 revenue track miles for rail operations 8.8 miles of track miles for cable car operations 219.9 miles of overhead wires & 25 power substations Nearly 1,000 transit vehicles, plus paratransit vans & support vehicles 19 operations, maintenance & administrative facilities 40 off-street parking garages & lots 1,184 signalized intersections & approx. 224,000 signs 28,862 on-street metered parking spaces 208 miles of bicycle facilities (Classes I, II and III) Numerous transportation information & communications networks
Overhead Contact System Assets by Component Total Value = $3.9 Billion
Agenda Agency context Assembly of asset inventory Identification of capital projects Initial application of asset inventory Implementation of enterprise asset management system Next steps for application of asset inventory
Identifying Capital Projects Update to 20-year Capital Plan is concurrent with development of asset inventory Easier for SFMTA and the public to relate priorities to capital projects rather than assets Consensus-based process generated priority scores for each capital project Capital projects mapped to assets: assigns project priorities to each line-item asset
Prioritizing Capital Projects Decision Lens is a consensus-based decision support tool that provides quantitative analysis of qualitative project evaluation criteria Executive Team identified and established relative importance of evaluation criteria Capital Working Group scored projects against evaluation criteria Structured process leading to greater collaboration, transparency, efficiency, and consistency
Project Priorities Using Original Evaluation Criteria Weights
Project Priorities with Increased Priority of Safety and Security
Project Priorities with Increased Priority of Environmental Sustainability/Remove System Reliability
Project Priorities Based Only on System Reliability/Maintains a State of Good Repair
Agenda Agency context Assembly of asset inventory Identification of capital projects Initial application of asset inventory Implementation of enterprise asset management system Next steps for application of asset inventory
Developing a 20-year Financial Plan FTA response to FY2009 New Starts required comprehensive asset-based examination of infrastructure renewal needs The RTCI database provided basis for analysis MBTA SGR database provided the platform to conduct the analysis
SGR Analysis Addresses Four Fundamental Questions What is the magnitude of the SGR backlog? How much larger will the SGR backlog grow if we continue to fund at the current level? How much more do we need to spend to maintain the current SGR backlog? How much more than that do we need to spend to reduce the SGR backlog to zero?
Annual Unconstrained Needs by Asset Class Addressing Backlog
Agenda Agency context Assembly of asset inventory Identification of capital projects Initial application of asset inventory Implementation of enterprise asset management system Next steps for application of asset inventory
Implementation of EAM System Integrated within existing SFMTA capital planning/ programming processes to establish clear program goals and objectives related to the state of good repair, safety, and reliability of existing assets Still support SGR measurement and monitoring processes Develop a centralized system to capture asset data currently maintained in over 15 independent databases
Refinement of Asset Inventory • Procurement of data storage hardware • Asset data collected using repeatable condition assessment approach: • Annual assessments of vehicles • Biennial assessments of facilities • Triennial assessments of rail assets • Level of detail will at minimum meet the most detailed level for RTCI purposes
Initial Condition Assessment Conducted via on-site inspection by qualified engineering staff Conditions assessed with industry best practices Use large or near-complete samples for initial assessment for accuracy Asset condition and replacement needs derived from the asset age and maintenance and utilization history Data applied for direct needs assessment and development of SFMTA specific asset decay curves Frequency of subsequent assessments determined by asset type Will estimate the decay curves for uninspected assets.
Timeline for EAM Implementation Activity Start Finish Scoping the Procurement Aug 2011 Nov 2011 Develop Business Processes Dec 2011 Mar 2012 Solution Selection Mar 2012 May 2012 EAM System Implementation Jun 2012 May 2013
Agenda Agency context Assembly of asset inventory Identification of capital projects Initial application of asset inventory Implementation of enterprise asset management system Next steps for application of asset inventory
Next Steps for SGR Analysis Break large asset groups into smaller constituent projects to avoid having too many renewal/ replacement actions with the same priority score Update in service year and useful life of assets based on field inspection and assessment of individual assets Integrate EAM data and staff knowledge to link asset condition to O&M costs to more fully assess life-cycle costs Expand analysis beyond 20-years
Advancing the Asset Management Framework Condition-driven Maintenance Costs & Reliability Impacts Operating Budget