Ansoff Matrix
Ansoff Matrix. 1.What is Ansoff matrix?. 1.What is Ansoff Matrix. The Ansoff Growth matrix is a tool that helps businesses decide their product and market growth str ategy

Ansoff Matrix
E N D
Presentation Transcript
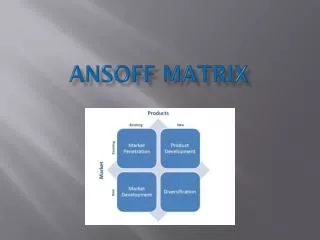
Ansoff Matrix 1.What is Ansoff matrix?
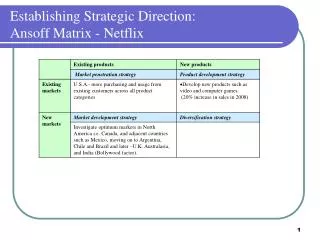
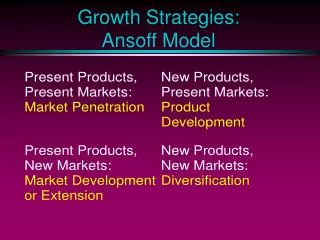
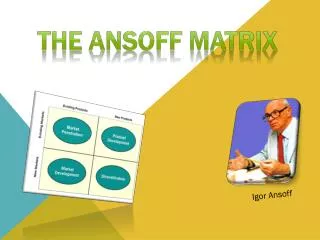
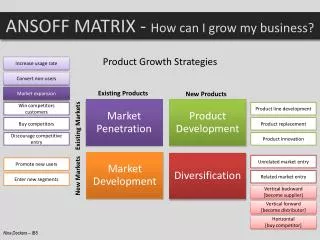
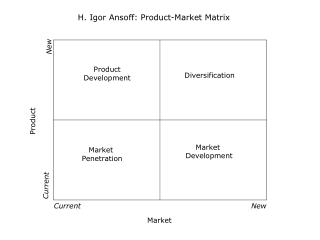
1.What is Ansoff Matrix • The Ansoff Growth matrix is a tool that helps businesses decide their product and market growth strategy • Ansoff’s product/market growth matrix suggests that a business’ attempts to grow depend on whether it markets new or existingproducts in new or existing markets.
Market Penetration: Here we market our existing products to our existing customers. This means increasing our revenue by, for example, promoting the product, repositioning the brand, and so on. However, the product is not altered and we do not seek any new customers. • This is usually used for increasing the market share of a company.For example if Pepsi can market their product better than Coca-Cola they will make a better profit than Coca-Cola and they will increase their market share.
Market Development Here we market our existing product range in a new market. This means that the product remains the same, but it is marketed to a new audience. Exporting the product, or marketing it in a new region, are examples of market development. • This strategy can be exampled like this if Cola-Turca a Turkish company who decides to expend their product to a new region such as England so they start to sell their cola in there • This is a weak strategy if there is so many rival companies at the place such as Pepsi and Cola in England
Product Development This is a new product to be marketed to our existing customers. Here we develop and innovate new product offerings to replace existing ones. Such products are then marketed to our existing customers. This often happens with the auto markets where existing models are updated or replaced and then marketed to existing customers. • This one in Coke companies came up with pepsi with Pepsi Blue and Pepsi Twist • This development increased pepsi’s • Profit by %15
Diversification This is where we market completely new products to new customers. There are two types of diversification, namely related and unrelated diversification. Related diversification means that we remain in a market or industry with which we are familiar. For example, a soup manufacturer diversifies into cake manufacture (i.e. the food industry). Unrelated diversification is where we have no previous industry nor market experience. For example a soup manufacturer invests in the rail business.
Questions • If Coca-Cola starts to manage Parties what strategies did they use? Would it be profitable for them? • If adidas starts a Television company in North africa what strategies did they use? Which of the ansoff strategies are profitable in our day?
PORTER’S GENERIC STRATEGIES Muratcan Karaduman
PORTER’S GENERIC STRATEGIES • Michael Porter is a professor in the Harvard Business School and also the president of the Institute for Strategy and Competitiveness. His simple diagram of competitive strategy became very popular in the 1980s, and it is even more popular in today’s competitive world.
McDonald’s / Wal-Mart • McDonald’s and Wal-Mart use the same strategy which is the Cost Leadership in the Porter’s Generic Strategies Diagram. They are the lowest cost suppliers of a certain product in the market that they are competing in. Because they use strategy, they are the market leaders and they are very profitable.
Nike / Coca Cola • Altough these companies’ products does not have a lower cost compared to other companies, they use another strategy from the Porter’s Diagram, which is Differentiation. Branding is what makes people to recognize the products of these companies. The hand writing of Coca Cola and the swoosh of Nike are two of the brilliantly chosen logos.
Ferrari / Rolls-Royce • These companies use the Differentiation Focus strategy. They offer quality products for premium cost, but they have a narrower target of customers compared to other car firms.
Ikea • Ikea uses the Cost Focus in Porter’s Diagram. They combine good quality and good function with low prices.