Download
1 / 8
90 likes | 230 Vues
Overview of Climate Change. Lesson 3. Intro to Climate Change. Objective: The goal of this activity is to do a cursory introduction of the ways carbon dioxide enters and leaves the atmosphere by showing the carbon cycle with a cartoon and graphic organizer. Time needed: 50 minute class period

E N D
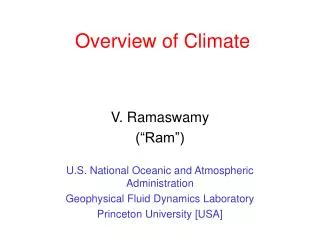
Overview of Climate Change Lesson 3
Intro to Climate Change Objective: The goal of this activity is to do a cursory introduction of the ways carbon dioxide enters and leaves the atmosphere by showing the carbon cycle with a cartoon and graphic organizer. Time needed: 50 minute class period Procedure: This activity will work well when beginning the teaching of climate change to first year chemistry students. This cartoon will set the stage for discussing how carbon dioxide enters the atmosphere and why carbon dioxide amounts in the atmosphere impact global climate change. The eight minute video clip (http://www.youtube.com/watch?v=1o4ODWMZq5U) is to be used in conjunction with a pictorial graphic organizer (attached). Students will complete this graphic organizer with colored pencils while watching the clip. Begin class discussion with questions such as: “What is the difference between weather and climate?”, “How can we as a general population find out if Earth’s average temperatures are changing over a long period of time?”, “What might be factors in causing the Earth to warm up or cool off?”… Give each student a copy of the graphic organizer and a red, green, and blue colored pencil. As the cartoon lists components of each of the spheres, have students list these in the marked areas of the graphic organizer. As students watch the video, pause every few seconds to explain how carbon is either leaving or entering the atmosphere. Have the students indicate carbon dioxide entering the atmosphere with a red arrow from the emitter of carbon to the atmosphere. Have students indicate carbon dioxide leaving the atmosphere with a blue arrow pointing to the part of the cycle that is absorbing the carbon. Carbon moving between objects (not directly leaving or entering the atmosphere) will be indicated with a green arrow. After completing the graphic, have students discuss the relationship between the number of ways carbon is put into the atmosphere, ways it is removed, and the carbon that is a direct result of human activity. To end the class period, begin a class discussion with ways the amount of carbon in the atmosphere may have changed since the Industrial Revolution. The attached PPT slides may be helpful in this discussion. Assessment: For homework, have students read the article from suite101.com/article/the-origin-of-fossil-fuels-a74321 and write a summary paragraph on how fossil fuels originated, when they originated, and where we find these fuels today. During the next day’s class discussion, emphasize the point that these carbon compounds have been locked under the surface of the Earth for millions of years and huge amounts have been brought to the surface and released into the atmosphere in a relatively short period of time (since the Industrial Revolution). This release rate is occurring at a greater rate than the Earth has been able to absorb through natural processes such as photosynthesis and ocean absorption.
Why is the atmospheric level of CO2 important to climate change? CO2 is in a class of gases called Greenhouse Gases (GHG) Because of the shape of the CO2 molecule, CO2 and a few other atmospheric gases can trap heat against the Earth. http://www.edf.org/climate/basics-global-warming
How do we know what the CO2 levels were in the past? Scientists collect data from several sources and compare CO2 amounts for the same year to arrive at the best estimate. This is called using proxy data. http://www.atmosedu.com/Geol390/Life/CliamteProxyData.html
How is the CO2 level measured today? Mauna Loa Observatory (MLO) is a premier atmospheric research facility in Hawaii that has been continuously monitoring and collecting data related to atmospheric change since the 1950's. The undisturbed air, remote location, and minimal influences of vegetation and human activity at MLO are ideal for monitoring constituents in the atmosphere that can cause climate change. The observatory is part of the National Oceanic and Atmospheric Administration (NOAA) - Earth System Research Laboratory (ESRL) - Global Monitoring Division (GMD). http://www.esrl.noaa.gov/gmd/obop/mlo/
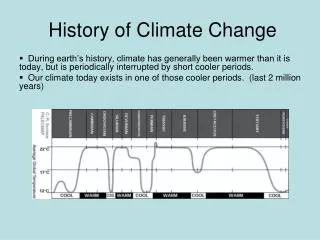
Combination of Proxy Data and Mauna Loa Measurements Note: The Industrial Revolution was from 1750-1850. http://www.skepticalscience.com/co2-measurements-uncertainty.htm
Where are we now? http://co2now.org/