Download
1 / 15
150 likes | 168 Vues
This project aims to support the success of clinical trials, provide evidence for decision-making, address scientific priorities, and promote collaboration. The focus is on improving protocol development efficiency to shorten timelines without compromising quality. Various time-based measures are analyzed to identify areas for improvement and enhance performance accountability.

E N D
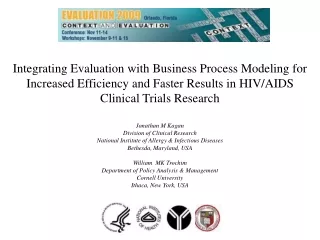
Integrating Evaluation with Business Process Modeling for Increased Efficiency and Faster Results in HIV/AIDS Clinical Trials Research Jonathan M Kagan Division of Clinical Research National Institute of Allergy & Infectious Diseases Bethesda, Maryland, USA William MK Trochim Department of Policy Analysis & Management Cornell University Ithaca, New York, USA
The HIV/AIDS Problem Adults and children estimated to be living with HIV, 2007 Eastern Europe & Central Asia 1.5 million [1.1 – 1.9 million] Western & Central Europe 730 000 [580 000 – 1.0 million] North America 1.2 million [760 000 – 2.0 million] East Asia 740 000 [480 000 – 1.1 million] Middle East&North Africa 380 000 [280 000 – 510 000] Caribbean 230 000 [210 000 – 270 000] South & South-East Asia 4.2 million [3.5 – 5.3 million] Sub-Saharan Africa 22.0 million [20.5 – 23.6 million] Latin America 1.7 million [1.5 – 2.1 million] Oceania 74 000 [66 000 – 93 000] Total: 33 million (30 – 36 million) Total: 33 million (30 – 36 million)
Evaluation Project Goals • Support the success of the clinical trials programs • Provide empirically based evidence about process and outcomes to guide decision making and program improvement • Ensure the highest scientific priorities are addressed • Promote collaboration and shared learning • Increase efficiency and research integration • Develop a culture of ongoing evaluation 5
Stakeholder-Identified Critical Success Factor Concept Map 85 89 86 50 17 46 79 61 Relevance to Participants Biomedical objectives 47 5 15 73 82 20 22 Community Involvement 30 37 74 60 77 78 64 Scientific 7 57 42 27 Agenda - setting 68 63 13 4 31 16 83 69 71 19 11 62 84 80 87 26 54 48 32 28 9 41 39 55 52 14 33 24 58 21 35 23 29 76 90 Resource 53 59 12 3 67 Utilization 49 91 75 51 36 34 56 2 1 45 10 40 70 38 43 6 25 66 Operations and 8 DAIDS Policies and Procedures 44 88 18 Management 81 72 65
Operations, Policies and Resources ü ü ü ü ü • Focus • Administrative polices, funder polices and procedures, process efficiency and site capacity • Lead Evaluation Question • How can the process of protocol development be improved to increase efficiency and shorten the timeline? • How long does each phase of the protocol development process take? • What are the limiting factors in the protocol development process? • How can we shorten the timeline without compromising quality? • How can the process be improved? • What are reasonable targets for each phase?
Wireless Web Services Person and Institution Registry Desktops DAIDS Enterprise Information System DAIDS Adverse Experience Reporting System Clinical Site Monitoring Protocol Registration Protocol Management IND Management Enterprise Foundation
DAIDS Harmonized Protocol Statuses Withdrawn Proposed In Development Pending Open to Accrual Enrolling Closed to Accrual Closed to Follow Up Participants Off Study & Primary Analysis Completed Concluded Archived
Note: The numbers shown above the bar represents the total number of days for SRC Review Process (A+B) A= Days from Protocol Receipt to SRC Review B= Days from SRC Review to Consensus Distribution
Protocol Timeline Summary Receipt to Comments Distribution (single) 358 days 27 days 381 days 15 days Receipt to Review (single) 233 days 133 days Pending to Open to Accrual 100 days Receipt to CSRC Review (Multiple) 23 days 125 days SRC Review Completion to RAB Sign Off Open to Accrual to Enrolling 160 days Pending to v1.0 Site Registration (US Sites) 517 days Pending to v1.0 Site Registration (Non-US Sites) 780 150 750 30 60 90 120 180 210 240 270 300 330 360 390 420 450 480 510 540 570 600 630 660 690 720 Days
What Good Are These Time-Based Measures? • Time measures provide a coarse-grain look at processes – kind of a composite ‘smell test’ • Sometimes it’s the process itself • Other times it’s the resources/capacity that’s rate-limiting • Time measures can help develop focus on where improvements could be sought • Excessive time is a disincentive to clinical research • We should evaluate quality/value but we may lack the ability or know-how – time studies can get us started
What Have We Learned and How Can We Put it to Use? • Things that appear worth considering from these time-based protocol analyses: • Shorten/simplify processes that consume time disproportionate to their ‘value’ • Develop means of assuring performance accountability • Set a ‘drop dead’ date for protocol initiation
Acknowledgements • Evaluation planning and concept mapping • Mary Kane, Concept Systems, Inc. • Kathleen Quinlan, Concept Systems, Inc. • Scott Rosas, Concept Systems, Inc. • Protocol event analyses • Suresh Varghese and Alex Varghese, Digital Infuzion, Inc. • NIAID HIV/AIDS Networks • Jeffrey Schouten, Network Coordinating Center, FHCRC • Network Leadership, Operations Centers, Data Centers